
It’s that time of the year for row crop producers. Old-crop supply has been cemented, essentially finalized on Jan. 12, when the USDA gave producers news they didn’t want, neighbors with a lot more corn than yesterday. While supply is final, demand numbers are still very much in flux as they need to play out for the next 7 months. All the while, producers are starting to focus on planting the 2026 crop, and the markets are trying to figure out what those producers are going to do. This weird limbo between old and new crop fundamentals can make marketing this time of year quite difficult.
Last year was a great example of that. Old-crop fundamentals for corn, namely exports, were screaming and the balance sheet was tightening. Around that time, it’s our opinion that large speculators, who had built a massive, long position, were starting to understand that the U.S. producer was going to plant A LOT of corn. Not sure anyone saw 98.8 million planted acres coming, if you did, we have a job for you here, but the bottom line is that new-crop fundamentals started to dominate price activity before we knew what they were. Futures sold off starting in late February and simply never looked back. The sell-off started on Feb. 20 to be exact. This year we have been calling for a rally into February, which to some extent we’ve seen, but this year is not like last year in many ways. See the sidebar for more on that.
So, while we have spent most of our time here looking at old-crop fundamentals, and it’s frankly a bit early to feel confident about new-crop acres and certainly production weather. It is never too early to start looking at potential scenarios.
This is the start of new-crop speculation season.
USDA kicked it off last week with their Ag Outlook Forum, providing their first balance sheet for the 2026/27 crop year. It’s worth noting two things.
1. Historically, the accuracy of this report is terrible, even by the standards of USDA ‘haters.’
2. The first real USDA balance sheet for 2026/27, incorporating the first survey-driven acreage estimates, will not be released until May.
Regardless, these are the numbers many are working with for now and, immediately below, you will see our Bullish /Average /Bearish scenarios stacked up right next to the USDA Ag Outlook.
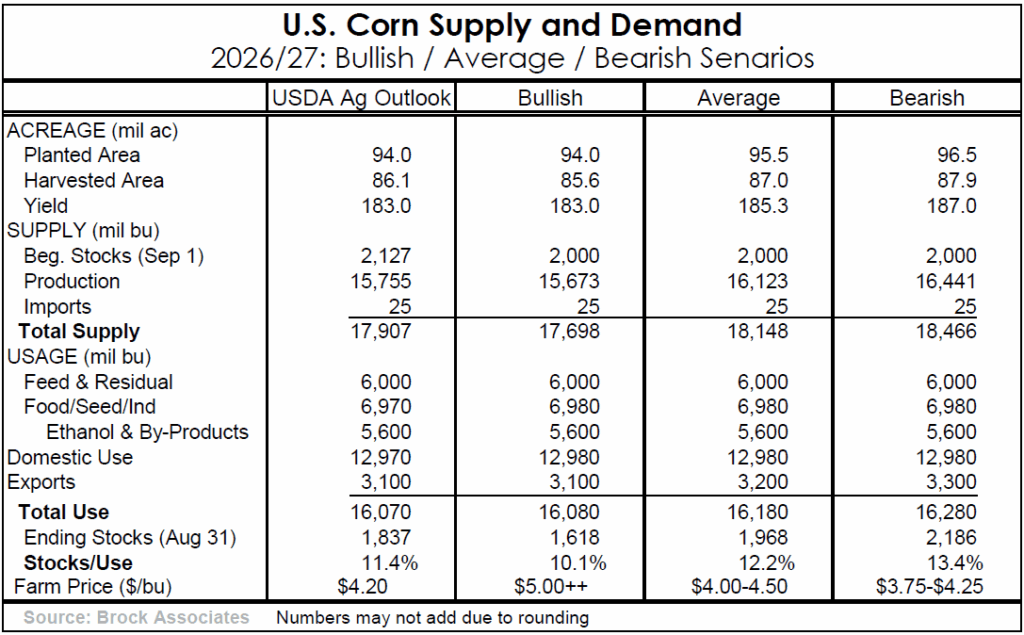
Let’s talk acres first. USDA printed 94 million planted acres and a yield of 183 bushels per acre. Both are bullish vs. our view of reality. We’d note that they printed 94 million acres of corn last year as well and were off by 4.8 mil. acres. They also printed 181 bpa yield, which ended up off by 5.5, but all anyone can do is flat out guess yield at this point. Put those together and production was off by 1.680 billion bushels, “just a bit outside” to quote Milwaukee’s own Bob Uecker. The point here is not to shame the USDA for these numbers. The point is that these are not actually estimates, and you should not believe them just because they are friendlier than what we’re about to say.
Let’s start with our “average” scenario. Still guessing of course, but our first shot in the dark is 96.5 million planted acres and for yield we’re at 185.3 bpa. Don’t shoot the messenger on yield; that’s not our opinion or even a guess, that is simply the mathematical trendline yield.
For all three scenarios, we’re carrying in 2.0 billion bushels, a rounder number that reflects our view of 2025/26 export demand more closely than what the USDA is printing. Could well come in lower. We’re matching USDA on all usage categories except for exports for the 2026/27 marketing year. The exports take some explaining. Feel free to skip this next paragraph if you want to stay out of the weeds.
First, this year’s export pace as often discussed here is outrageously strong, and it has been since March of 2025. Given everything, we think we know, we see no reason for that to slow, so while 3.1 billion bushels would still be the second largest marketing year exports in history behind only 2025/26, we feel this is near the low end of likely outcomes. Ironically and perhaps counterintuitively, we have exports at 3.1 billion bushels in the Bullish scenario, 3.3 in the average, and 3.2 in the bearish scenario. The bullish/avg./bearish scenarios are driven by supply, and demand will respond to that. Plant 94 and yield 183… prices will rise, and the world will start buying someone else’s corn. Plant 96.5 and yield 187… domestic prices will fall enough to encourage more U.S. exports. Slightly lower than the average because, after all it is our “bearish” scenario. The average scenario holds the largest export number, simply because that is what we would guess at this point.
Okay back to the big picture. It really all comes down to planted acres for now. All anecdotal reports are that farmers are going to plant as much corn or more than last year, but we find that to be extremely unlikely on a national level. Corn-on-corn acres are darn expensive. There’s a fair bit of financial stress, particularly in the south. And after adding nearly 8 million planted acres from 24/25 to 25/26, never mind the static number of 98.8, the U.S. as a whole is just going to plant less corn in our opinion. So, if you’re on board with that assumption, the question is: How many fewer acres?
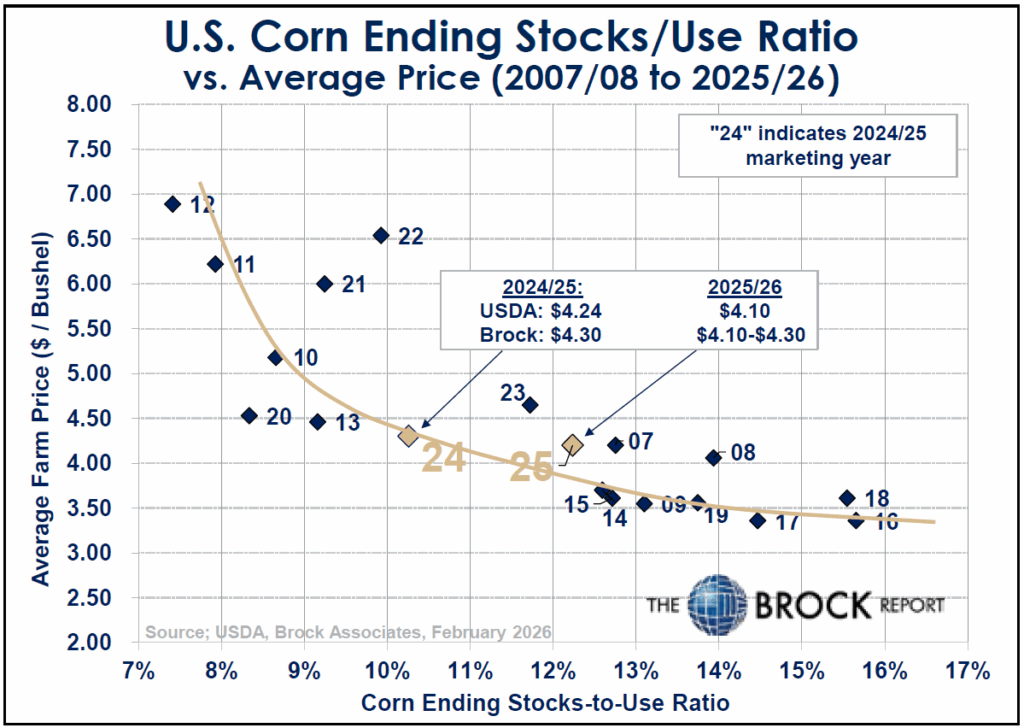
Our fear right now is that the Bullish scenario of 94 million acres is likely out of reach. But if we only plant 94 and yield 183, with even reasonably strong demand we are squarely infringing on bull market territory with a stocks-to-use of 10%. On the flip side, if we plant 96.5 and yield 187, we have a lot of corn, but the stocks-to-use ratio is nowhere near the 16/17 to 18/19 marketing year gluts. Futures should stay above $4.00.
Regardless of what you or we think is going to happen, because it almost certainly won’t, we need to understand these scenarios so that as the growing season plays out, we know what to do. We want to be on offense, not defense. We often preach the importance of not hanging onto a single fundamental belief, being a “one fundamental economist,” and letting it drive your whole marketing plan. Instead, put that down on the balance sheet and see where it nets out with every other assumption. Our net-net of this exercise is that while we are currently sitting on the largest pile of corn in U.S. history, even the bearish outlook from here really isn’t that bearish from today’s prices.
Patience will be key in navigating this transition from old-crop to new-crop. This year will not be like last year. Stay focused on what you know, and what you can control. If you set a timeline right now for what you want sold by the March Intentions report, by planting, by July 4, and by harvest, you’ve already done more than your neighbor.
Sidebar: A New Year
We spend some time in this week’s lead story discussing similarities between this year and last year, but no two years are alike, and there are some important differences between this year’s corn market and 2025.
First, while our discussions with farmers show most are planning to maintain their corn acreage, after surging by 8 million last year, this year acres almost have to contract. Rotational considerations come into play, and particularly with soybeans’ margin outlook looking better, corn-on-corn acres are less attractive. And we are not going to “find” more U.S. acres overall.
The positioning of market participants and current prices also point to more upside for corn versus a year ago. Last year’s weakness in corn starting in late February was driven by massive liquidation by large speculators holding a large net long position — which they do not hold right now. And most active futures are trading below $4.50 at the end of this week, compared to a price of $5.00 a year ago. New crop futures are trading below $4.70, versus $4.80 a year ago. Finally, note that last year’s market was bull-spread, while this year it is currently bear spread.
While this is no guarantee the market is poised to rally, all of the above points to a market that is at the least not primed for a selloff, as it was this time a year ago. From a marketing perspective keep this in mind and stay calm when the market does show some weakness.


