Wednesday of next week the USDA will release the August WASDE and Crop Production reports. This year is highly anticipated because of the potential for yield changes (particularly for corn) due to the stretch of heat and dryness the crops had to endure, and also because last year’s report was a huge surprise to the market. This is the USDA’s first yield estimate based on farmer surveys (as opposed to trendline calculations), and thus frequently produces a significant change, and price reaction.
As we prepare for the report, there are two historical lenses through which to do so. First, how much do the reports typically vary from the pre-report fundamentals? And second, how much do they typically move from the August release to the “final” USDA numbers?
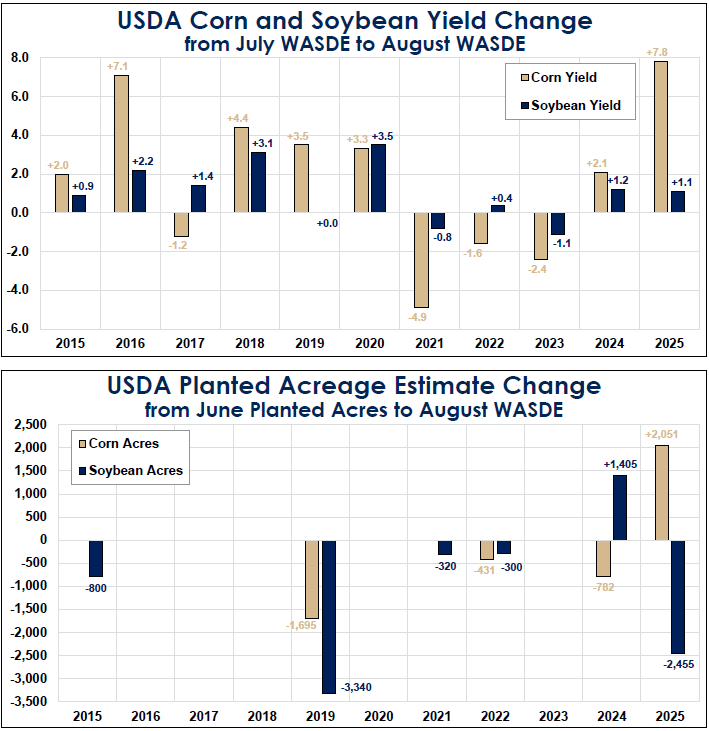
The top three graphics at right get to our first question. With the first survey-based yield reports, it is not surprising to see corn and soybean yields change frequently and dramatically. Since 2015, the corn yield has increased 7 times, and fallen 4. There have been 3 dramatic changes, +7.1 in 2016, -4.9 in 2019 and, of course, +7.8 last year. The soybean yield has increased 8 times over this span, fallen twice and remained unchanged only once.
Moving down one chart to acreage changes, we have one of the least compelling charts to ever make The Brock Report. USDA left planted area unchanged in 2016, ’17, ’18, ’20, and ’23. We include this chart, though, to show that the planted area changes over the last two years have been significant.
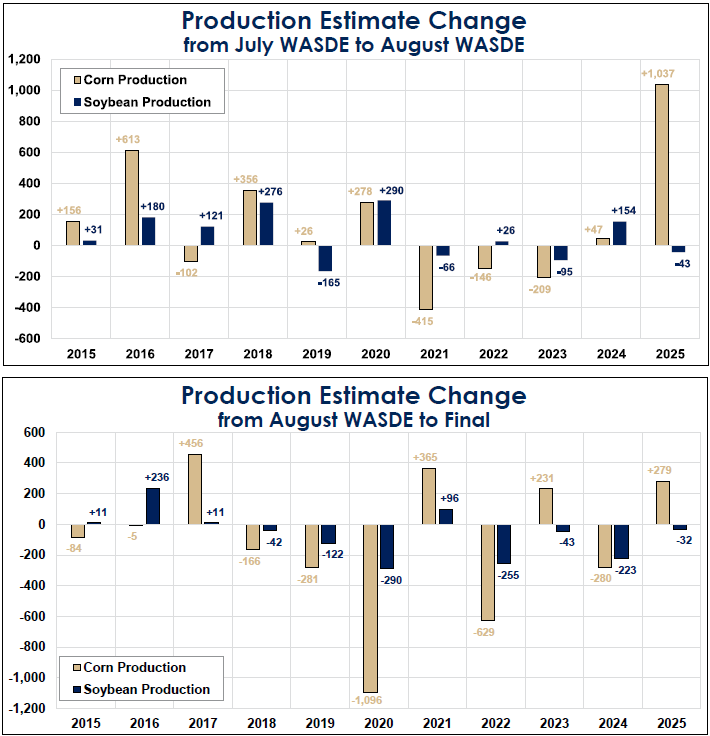
The combination of yield and acreage adjustments the last two years, in particular the increase in corn acres and yield last year, produced a massive increase in corn production from the July to August estimates. A 1.037 billion bushel, or 6.6% increase in corn production last year is one of, if not the most, surprising USDA data dumps in history.
Finally, the fourth chart shows how accurate the August report is at capturing the final supply picture. For the most part, pretty solid. 2020 was well off due to the Iowa derecho, and 2022 failed to capture the impact of drought on a large area of production. If we are to see significant revisions this year following Wednesday’s report, it could be for the same reason.
As always, it is the price reaction in the hours and days that follow the report that informs us on our market outlook. Last year’s corn market produced a clear example of “buy the rumor sell the fact”. Be sure to tune in to Wednesday’s Market Edge for a recap and reaction to the report.