
In previous discussions regarding technical analysis, whether in the Brock report or at one of our seminars, the topic of Moving Averages often comes up. A Moving Average is essentially a trend-following indicator that smooths out the price data by calculating the average over a certain period of time. For example, a 20-day Moving Average is simply the average of the last 20 closing prices plotted as a line on the chart. A Moving Average basically represents an average consensus of value over the period of time selected.
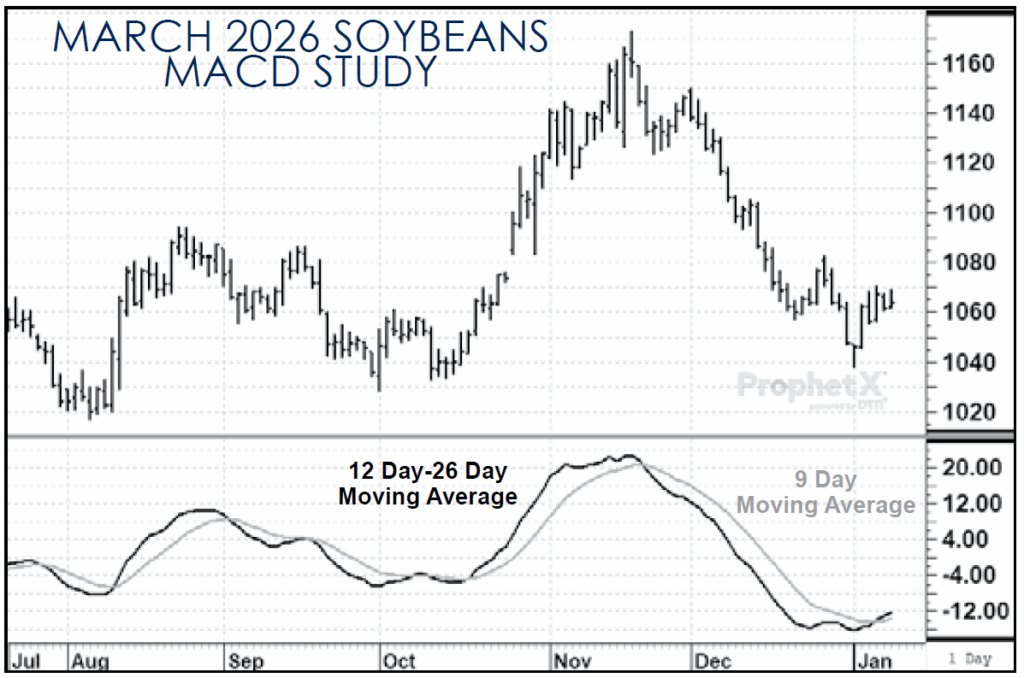
A more sophisticated and, in my opinion, a more reliable Moving Average signal, is what’s called a Moving Average Convergence Divergence, or MACD. This mathematical system consists of three exponential moving averages which form two lines on a chart whose crossovers give trading signals. There are two ways to create a MACD. One way is to calculate both the 12- and 26-day exponential moving average. Then subtract the 26-day from the 12-day exponential moving average and plot their difference as a solid line. Then calculate the 9-day exponential moving average and plot result as a dash line. These two lines generate the buy and sell signals when they cross.
The other way, if you don’t have a couple hours a day to do this by hand, is to simply use the MACD study that most computer-based price and charting systems provide. I only give you the specifics of how this technical study is calculated so you have a basic understanding. In the “old days,” technicians did have to do all these calculations. Now, we have computers.
The theory or rationale behind this trading signal, as explained by Dr. Alexander Elder in his book “Trading for a Living”, is as such: A longer-term moving average tracks long-term consensus, and a shorter-term moving average tracks short-term consensus. A crossover of these Moving Average lines identifies a shift in the balance of power of bulls and bears and the possible ending of a major trend.
Of course, like any technical system, the MACD is not foolproof and can give wrong signals. Also, a choppy sideways market produces more signals and choppy sideways results. As you know, we utilize technical analysis in numerous ways in an effort to identify trends and changes in trends in market price, as well as to reduce some of the emotions and stress inherent in making marketing and hedging decisions. I feel the MACD system is another valuable tool to add to your trading toolbox.
To apply this tool to a current market: Take a look at the March Soybean chart, it appears the MACD is signaling an end to the downtrend which began last November. The last two crossovers were spot on in identifying trend shifts.
Email David Behrel at dbehrel@brockreport.com


