Weekly COT Highlights – Week Ended Tuesday, March 25
Good Morning! It was a busy two weeks traveling the Midwest talking with producers from Nebraska to Ohio, thanks to everyone who came out! This weeks COT Analysis will include our typical SPEC/COMMERCIAL spread charts. The long term version and large spec breakdown graphics can be found here immediately after the reports as always.
Click Here to watch a video explanation of the COT reports.
Main Takeaways this Week
We were not able to cover last week’s COT which came out Monday afternoon due to travel, so we cover each COT at length below. There are too many significant takeaways to distill into bullets, so be sure to read through! (particularly the hogs)
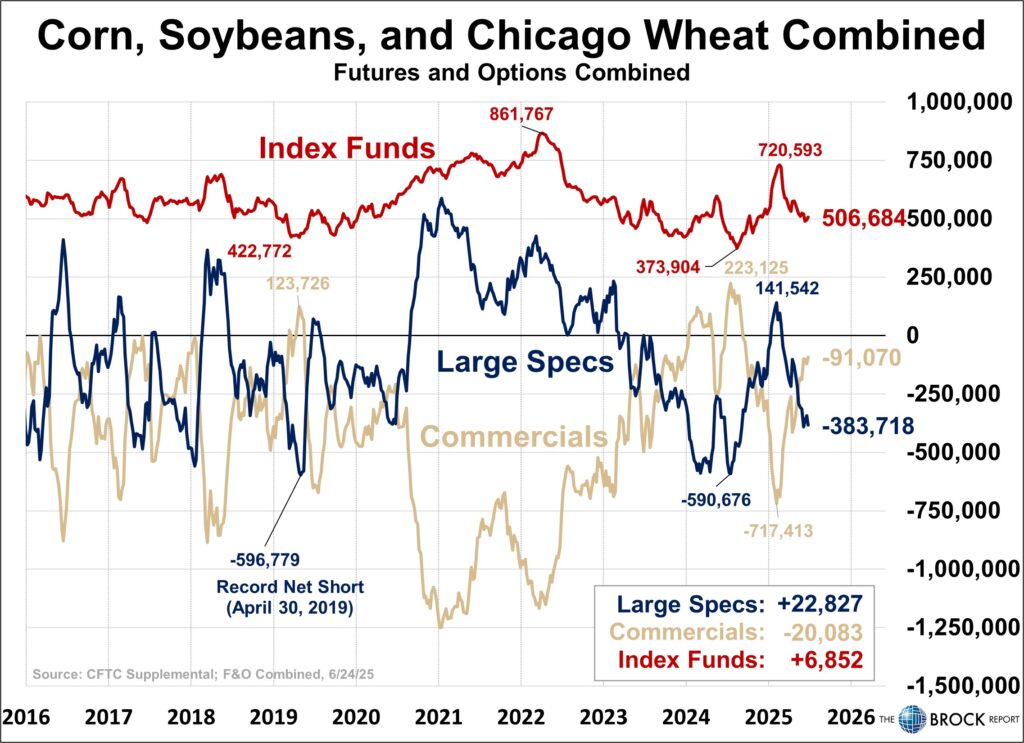
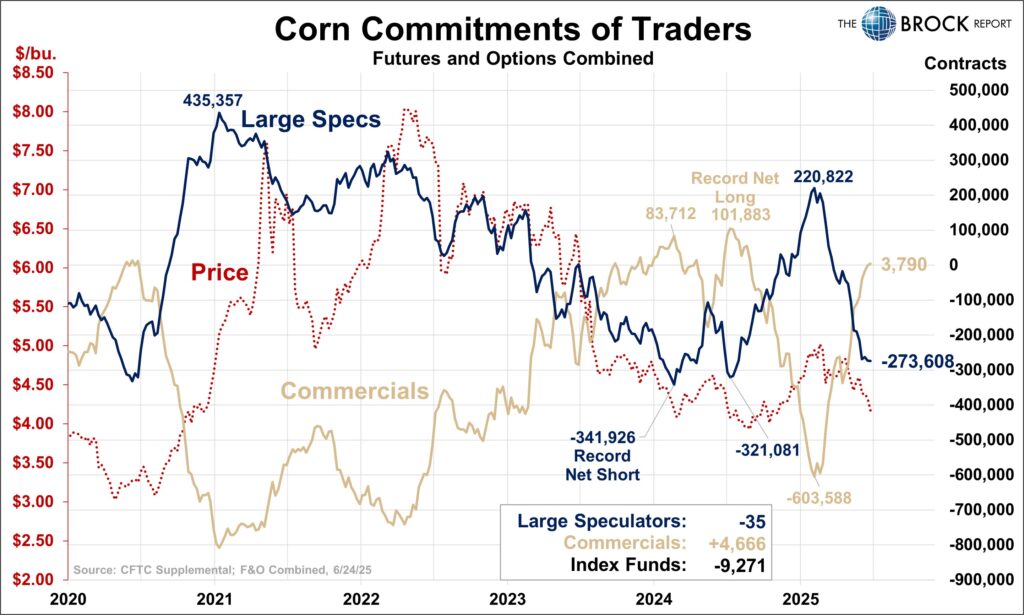
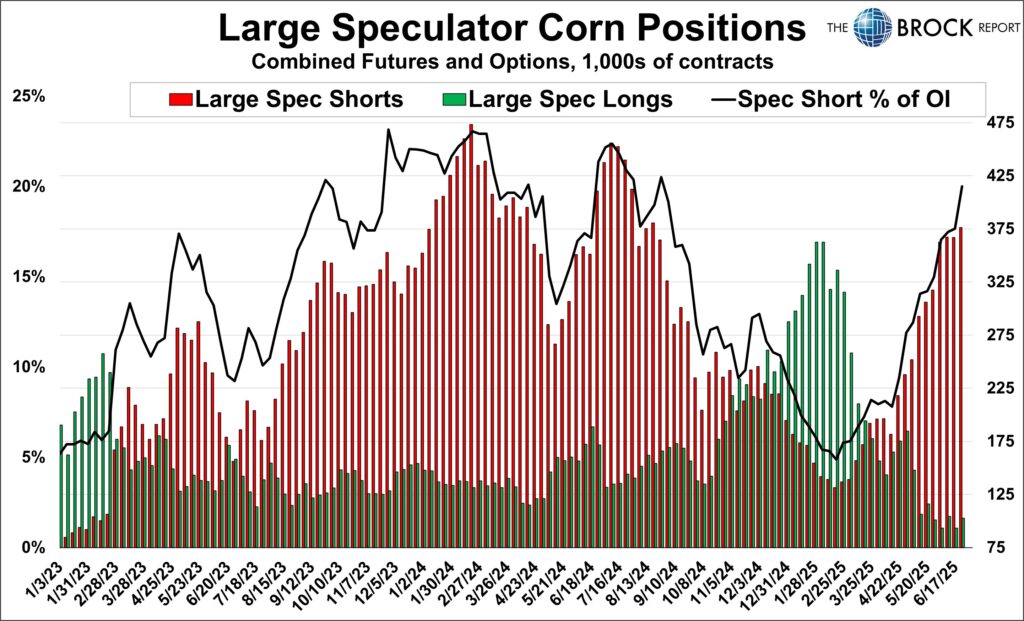
Corn
As shown above, Index funds continue to liquidate their corn holdings, that makes it 15 of the last 18 weeks for a 207,000 contract net long reduction. Immediately below, we see large specs were BARELY net sellers, yet this marks the 17th week of the last 18 that they were sellers, for a total net selling of 478,000 contracts. This selling streak for both followed the Feb 25 report, and could not more clearly demonstrate the effect we so often talk about here and the effect that large spec and index fund selling can have on prices. When specs and index funds are long, and commercials are short, that is a massive red flag that a sharp sell off could be coming. We warned of this move on Feb 14 and issued a literal “Red Flag” on Feb 28.
Looking forward, we are hoping for the exact opposite to happen. With the specs very short, it appears that this move lower could be coming to an end. Specs are near-ish their all time record short, and Index funds are well below their normal level of holdings, both within 70,000 contracts of historical lows. While records are made to be broken, history tells us that there is more of a chance of a sharp rally than continued sharp selloff at this point. That said, this report is meant to be viewed as a leading, sometimes lagging indicator of larger trends. It is not a timing tool. We will have to watch the report Monday and ensuing price action to determine and to time our actions.
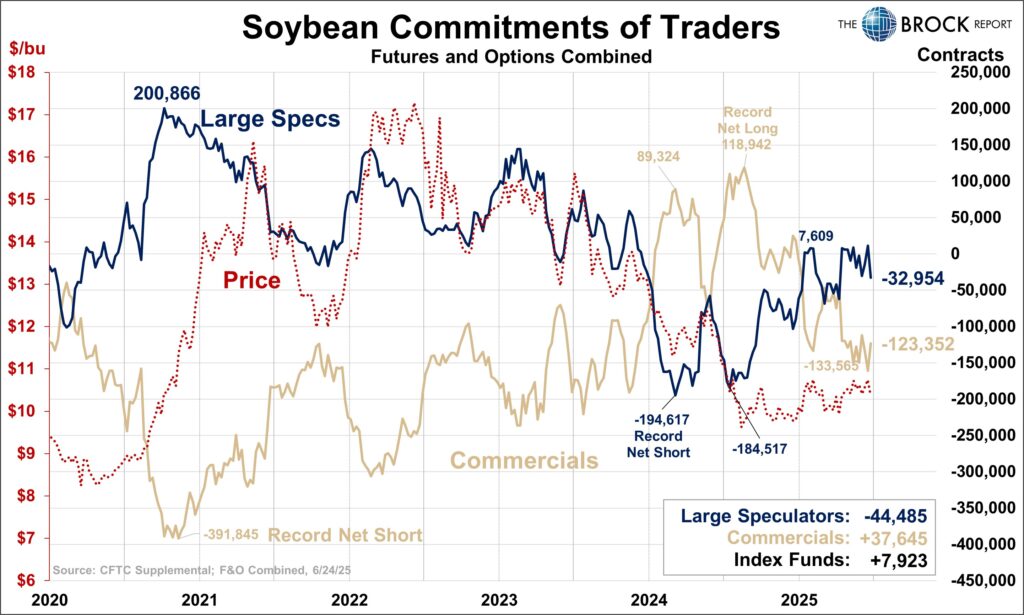
Soybeans
Different story here. Large specs were net sellers of nearly 45,000 contracts, their most aggressive selling week since the week ended January 16. 2024. You can see the impact that their selling had on prices from Nov. 2023 – Jan. 2024 below. They are a longgg way from their record net short, and if the fundamentals tell them to sell, they just might. The
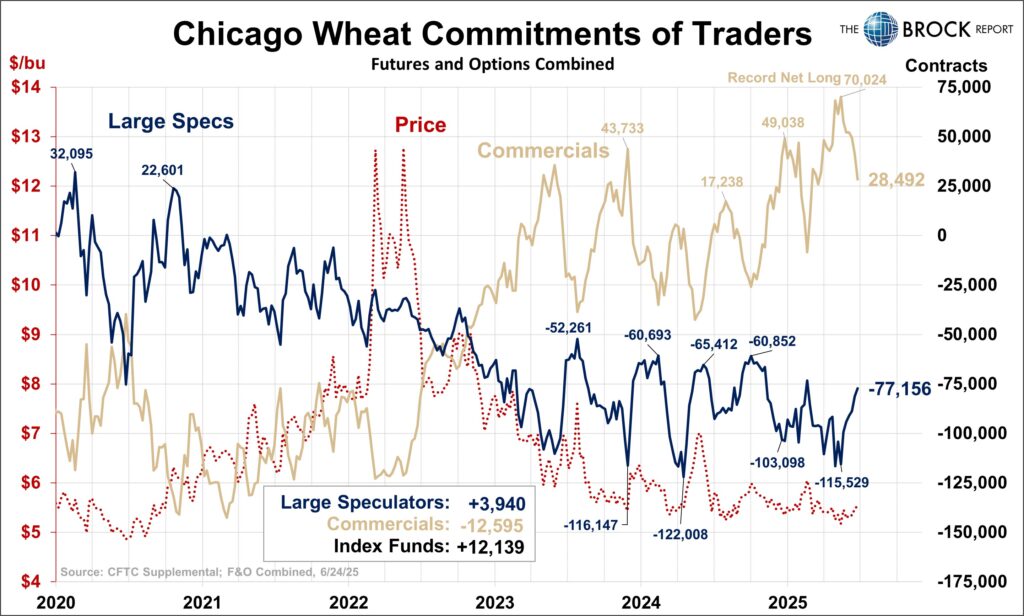
Wheat
We are firmly on the record here saying that spec short covering had the potential to cause sharp rallies in this market, and we got one, sort of. It has been a slow and orderly unwind from the speculators, coming in as net buyers 10 of the last 12 weeks, for a total of just 33,000 contracts. We are in the camp that any spec buying is a good thing, and that this is likely to continue to support prices, but given the failure to move prices higher over the past several weeks, our confidence has waned.
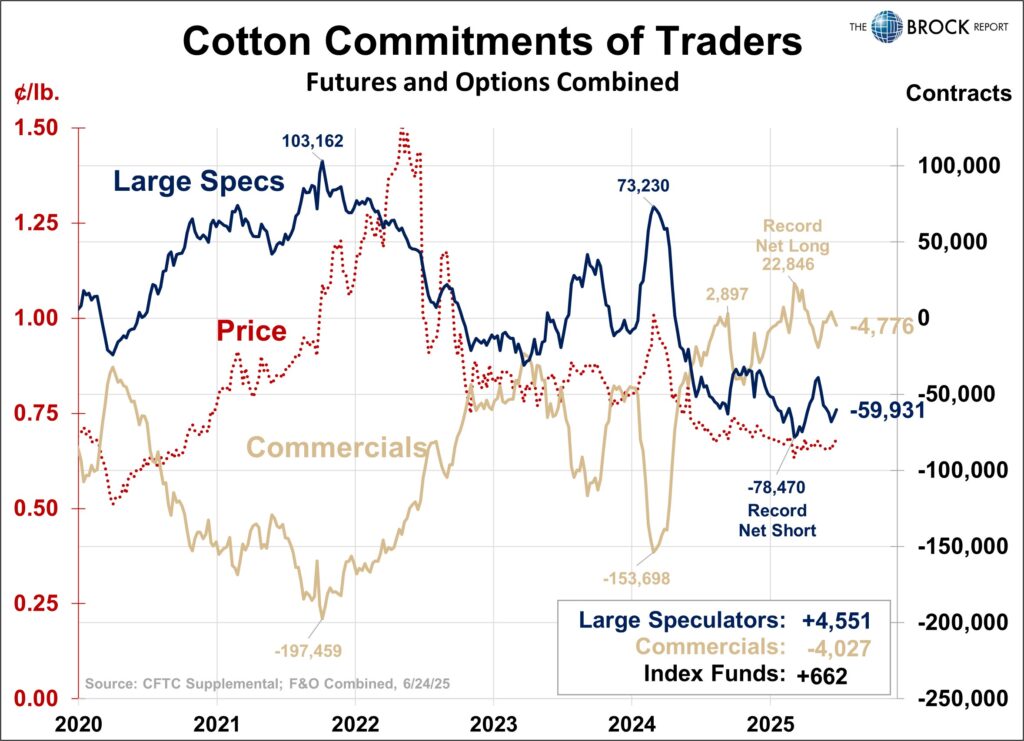
Cotton
Large specs were net buyers for the second consecutive week, and the price chart is starting to show signs of life. We exited our short December position for a small gain on Tuesday this past week, a sign of our confidence in the COT structure you see below, and the bullish key reversal posted on Monday. December has key trendline resistance at ~69.70, and horizontal resistance in the 70-71 cent range. If we take out the trendline a large rally is likely to occur. We have been on the 8.8 mil. acre island for a while, we’ll see Monday if we want to stay there or swim to shore.
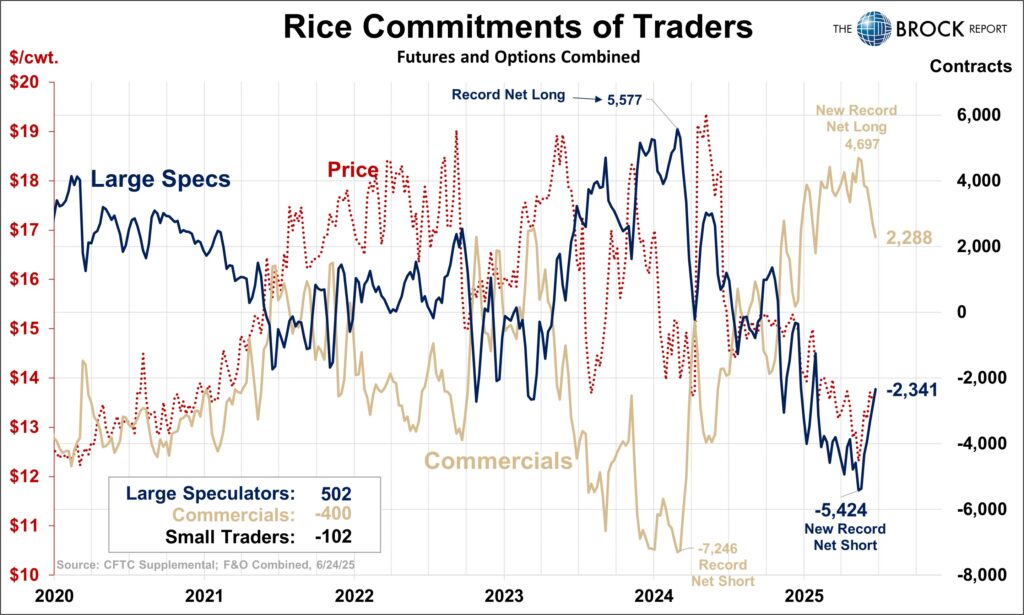
Rice
Sharp spec buying caused a sharp rally in rice, however this report is just through Tuesday of this week and the price action Wednesday-Friday was ugly. As you can see following the jagged blue line below, specs are not very consistent week to week, but broader trends clearly emerge. Given that we are just coming off of a record short spec position and record long commercial position, we expect this trend to continue, though it may be a rough (sic) ride.
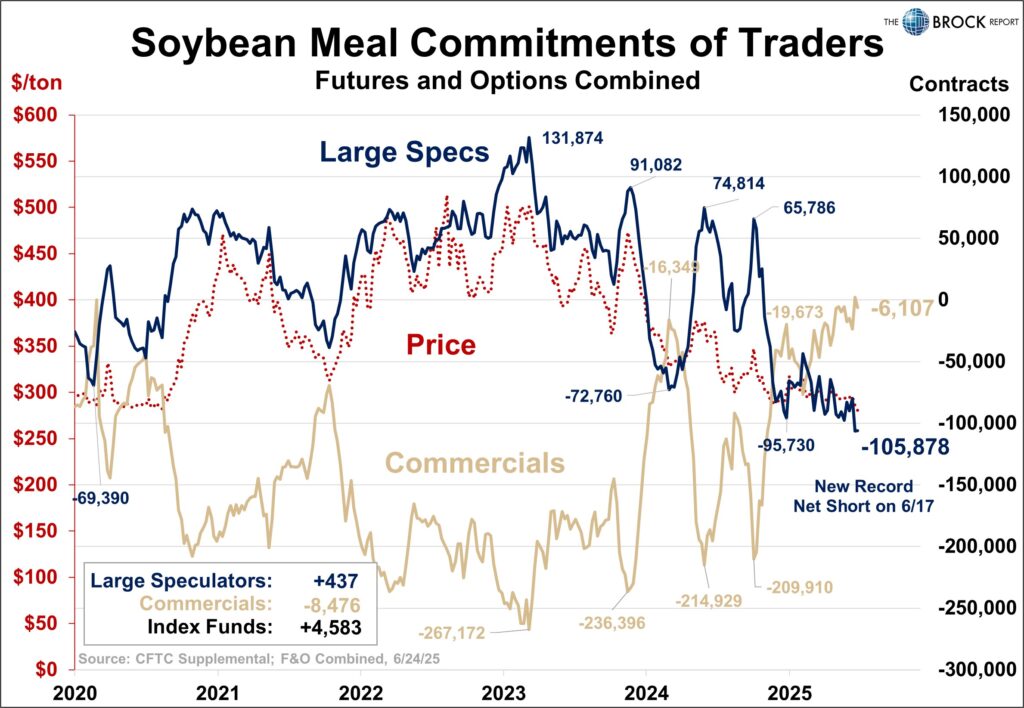
Soybean Meal
Soybean Meal specs hit a new record net short last week, and were very modest buyers in the week ended 6/24. Commercials are very near their record net long. This is a BULLISH setup. The price chart on the other hand…..
Bottom line is be looking for an opportunity to procure needs here. The big story driving prices this past week was from Argentina. If you supply this market with a bullish story, given the current price level, the massive number of spec shorts (all profitable positions), this is a market poised for a sharp rally.
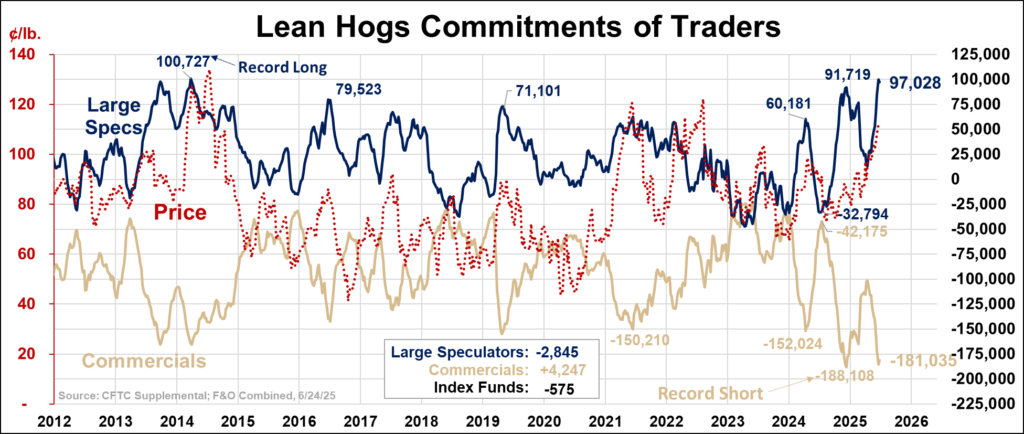
Lean Hogs
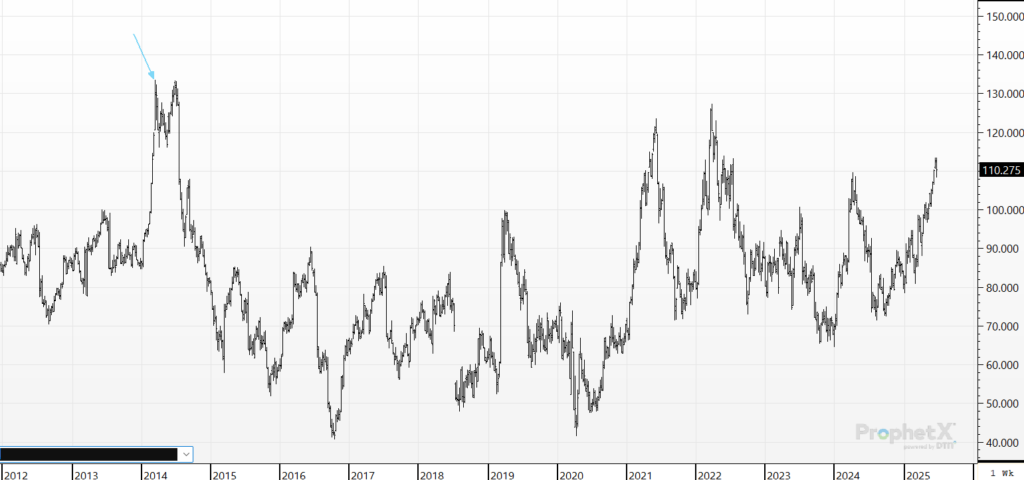
We’re going with the longer term COT chart below, so you can see the last time large specs were this long was in 2014, and they’ve only come close a couple other times. The price chart below is a weekly continuous most active futures chart, and the arrow is pointing to where the large spec long peaked. When we say spec selling can pressure a market, this is what we are talking about.
They were net sellers this week through long liquidation, which is a major red flag. After avoiding this move higher, we finally decided to jump into this market and recommended establishing short positions on 50% of 3rd and 4th quarter.
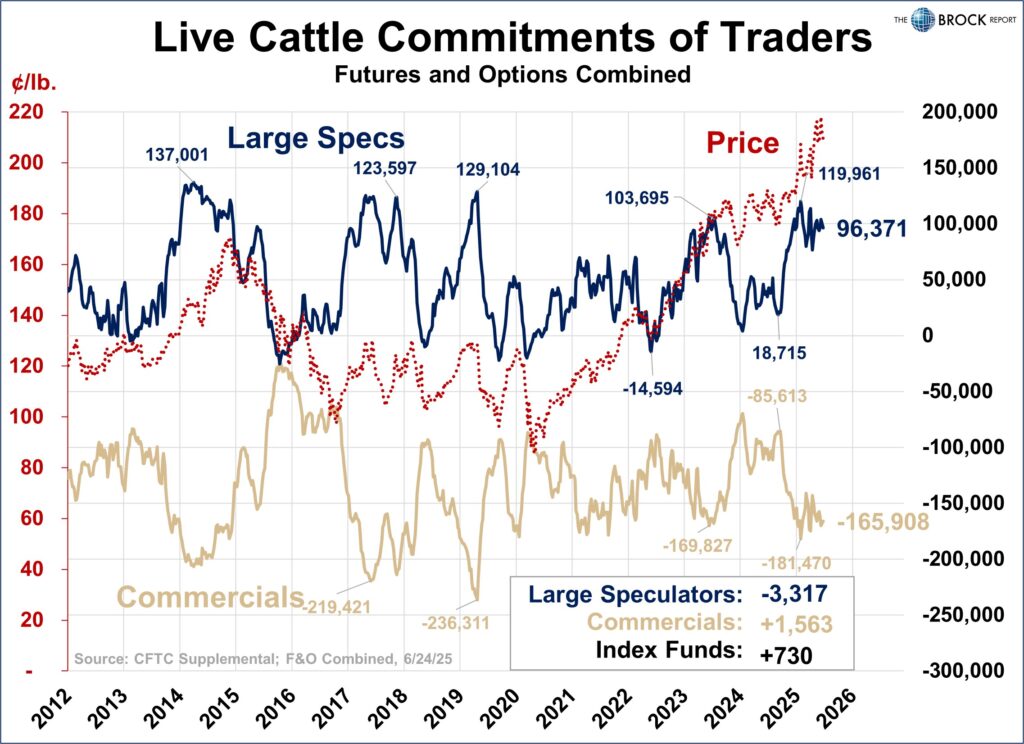
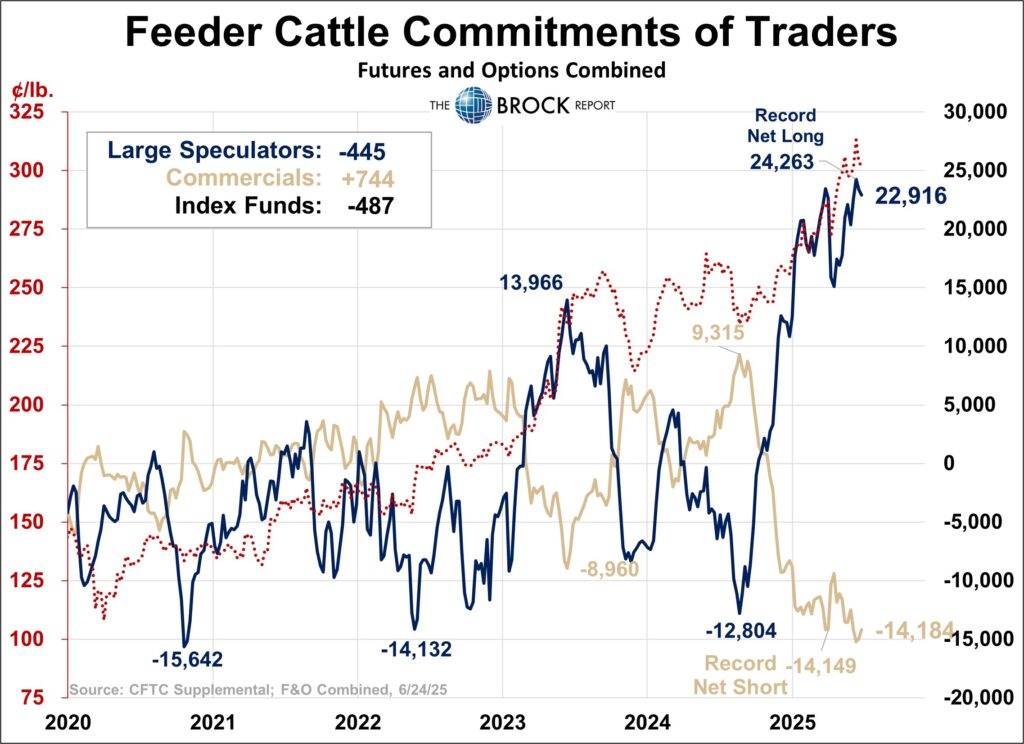
Cattle Complex
Specs are extremely long fats and feeders, and there is considerable downside potential in this market. Specs were net sellers of both markets the past two weeks, but this also happened in April.
Fundamentals will have to shift, but when they do this is going to be a potentially historic sell off. As far as when that will happen, who could say. This is a warning sign, not a technical signal.