
Technically, corn prices are indeed in a bull market. Since bottoming on August 26 at $4.14 ¼ in the May corn futures, the market has rallied and hit $4.90 earlier this week. That’s a gain of 76 cents per bushel. But more importantly, during the same timeframe basis levels have improved everywhere and most producers are looking at cash prices more than one dollar per bushel higher than Aug. 26. Few would have expected this kind of a move back then.
There’s a big difference between bull and bear markets in corn. A bear market needs no news at all. Bear markets fall from their own weight. Bull markets need new bullish news almost every day. The corn market over the last several weeks has been overwhelmed with bullish news. That has kept the drive to higher prices going longer than expected and now the question on everyone’s mind is whether or not the move is over.
January Crop Report a Game Changer
That is an understatement. The January crop report lowered the yield on this past year’s crop from a previous estimate of 183.1 bushels per acre to 179.3. The USDA further reduced the total crop size by 276 million bushels which resulted in USDA’s ending stocks estimate going from 1.738 billion to 1.54 billion. Just this past September, the USDA was projecting 2.057 billion bushels. They’ve dropped carry out 517 million bushels since then. That’s the largest drop in supplies that we can remember.
Basis levels have continued to remain strong. Exports are improving and we believe will continue to improve. Foreign countries and foreign companies buy more corn when it is relatively cheap. Good things happen on the demand side when prices are low.
The one potential negative in the corn market is that due to the price ratio with corn versus soybeans and the huge supply of soybeans in Brazil, everyone is expecting a big acreage shift from beans back to corn. This past year, U.S. farmers planted 90.6 million acres of corn versus 94.6 in 2023/24. It’s certainly reasonable to expect this year’s planted acreage to jump back to 94.0 million acres, which would result in an increase in carryover, but with improved demand, the increase would be small relative to this year’s loss.
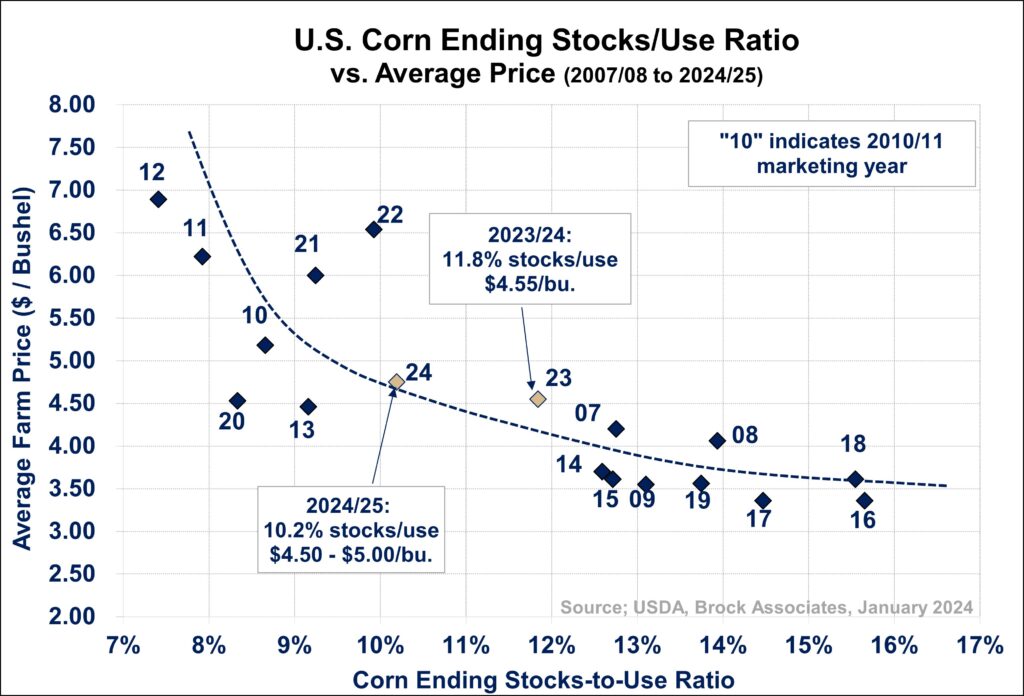
The magnitude of the change in the U.S. balance sheet can be more easily seen on the U.S. corn ending stocks-to-usage ratio vs. price chart on the next page. As recently as six months ago, USDA was forecasting a 14% stocks-to-usage ratio which would translate into an expected average price of under $4.00. Fortunately, that is not happening. With a stocks-to-usage ratio now expected to be approximately 10%, note on the graph that that translates to an expected average price of approximately $4.75. Our own estimate is that the average price of the corn that was harvested this past fall will average $4.50 to $5.00 per bushel (central Illinois). The USDA, in our opinion, is low at $4.25. The cash price this past Thursday in central Illinois was $4.76. That puts it right in the middle of our estimated range. Since the market started out substantially lower on September 1, simple math would indicate that there should be more on the upside.
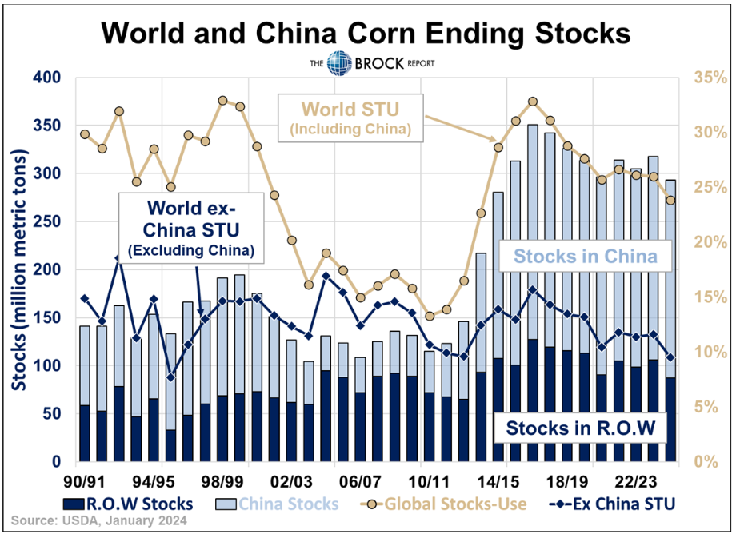
Now let’s turn our attention to the world market, specifically Brazil and China. The world ending stocks-to-usage ratio is now at the lowest level since the 2012/13 marketing year. If you exclude China’s stocks and usage, the world ex China stocks-to-use ration is 9.5%, the lowest since 1995/96. Even though Brazil has ramped up their production considerably (see chart below), both their domestic usage and export markets have improved even more than their production and carryover supply in Brazil is projected to be lowest since 2000/01. Their stocks-to-use ratio is typically around 10% but for 2024/25, it is projected to be 2.1%, the lowest since 1982/83.
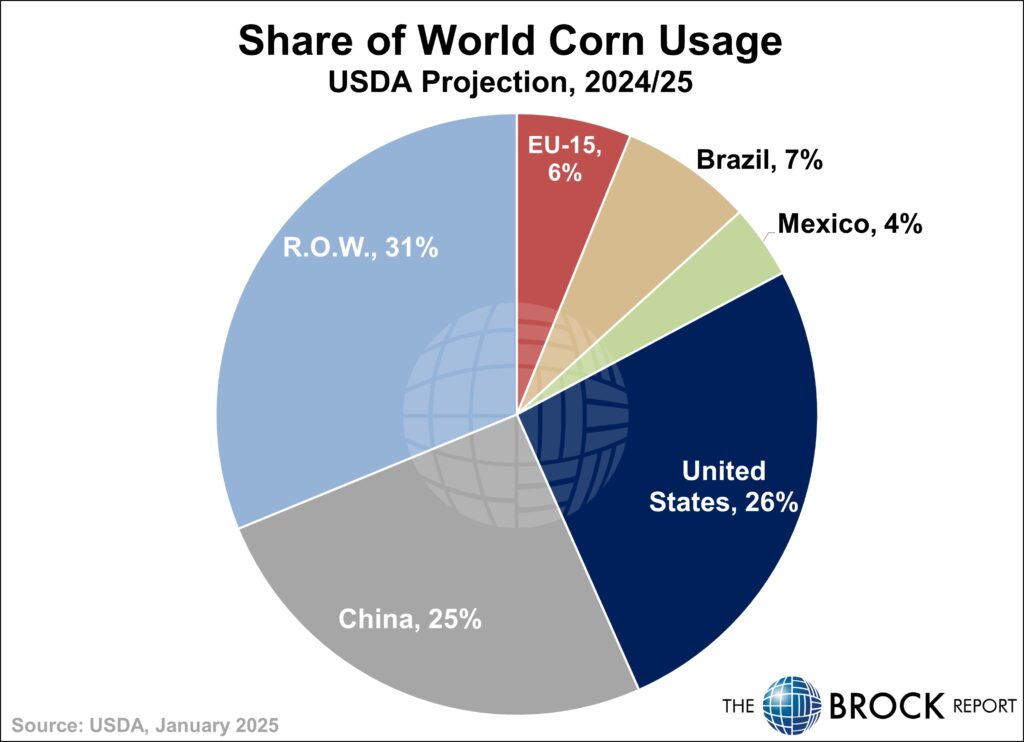
Two other graphs that are quite interesting. The first is the share of world corn usage. Note the United States has 26% and China 25%. Brazil and Mexico together combine for 11%. EU 15%. And then many smaller countries in the world combine for 31%.
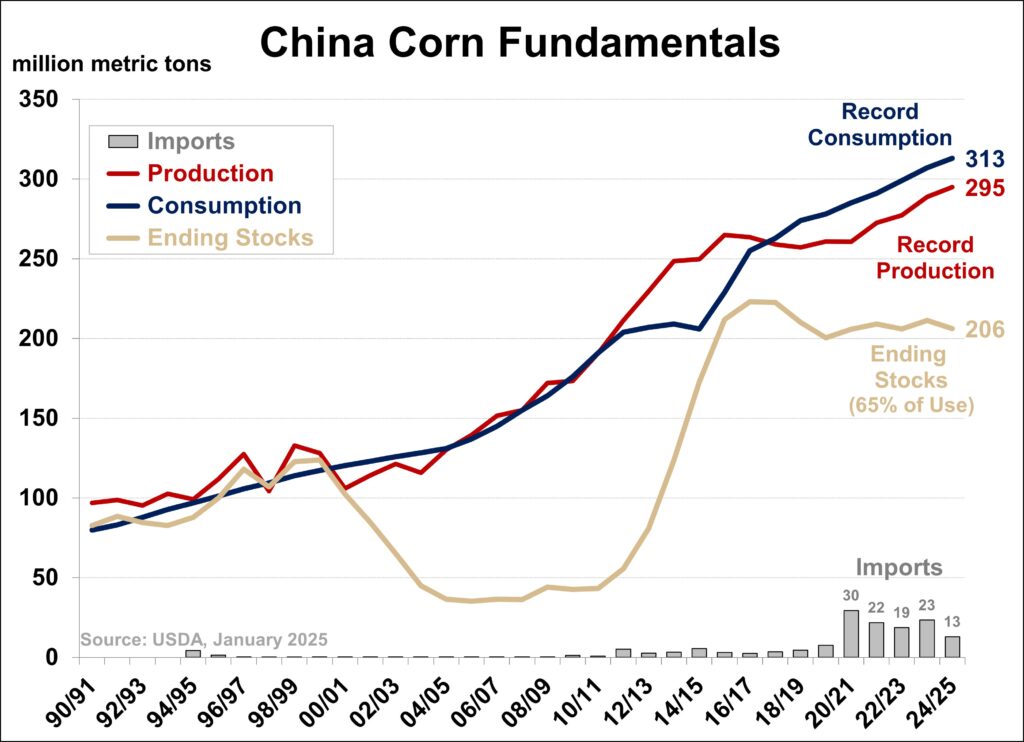
What’s interesting as well is that China stores so much corn. 70% of the world’s corn supply is stored in China compared to 13% here in the U.S. Also, note that the ending stocks number in China represents 66% of their total usage. Do they do that for food security in case they have a significant shortfall in production? Do they do it for national security reasons in case there is a war? You can let your imagination run wild but clearly their policy has changed dramatically since 2012 when ending stocks were substantially lower than now. See chart at bottom on page 5 for additional context on China. The other question on China is will President Trump enforce the agreement made when he was in office in his first term to buy substantially more corn than they have been buying? We think that is likely. But who knows?
Strategies
No one wants to let the value of the rally that has occurred since the first of September get away. At the same time, nobody wants to sell it too early in case the market continues to rally significantly. This is the game we all play as farmers, and as marketing advisors.
For one thing, May corn futures rallied back to the resistance area established in June of 2024. It’s a logical stopping point at least for the short-term. A minor correction in this market could take prices back to $4.65 in the May contract where the rally started after the release of the January crop report.
On the 2024/25 crop for hedgers, current advice has you at 60% priced and if we sold the remaining 40% today your average selling price for the entire crop would be $5.03. Cash-only marketers are at 70% sold and if the remaining 30% was sold today, your average selling price would be slightly over $4.80 in the cash market.
Our bigger concern is that we have not priced any corn for the 2025/26 crop. It’s highly unusual that, at this stage of the marketing year, we’re sitting completely unsold. Thus far, that looks like the right thing to have done, but will it be six months from now?
In reviewing the corn seasonality charts going back to 1970, in only two marketing years has the high of the cash market occurred in January. That was in 2019/20 and 1993/94. The top has occurred in February only one time in history and that was in 2006/07 marketing year. As we have mentioned in the past, odds don’t increase for a seasonal high in cash corn prices until the month of May when it has happened four times since 1970, and the highest odds are in June where the high has occurred ten times. June through August account for 50% of the marketing year highs since 1970.
If we weren’t so heavily sold on old-crop, then we’d be more inclined to be pushing old-crop and new-crop sales. But as of right now, the demand news is getting more positive by the day and even though everyone is expecting a large increase in planted acreage, the crop is not in the ground yet. Let’s just be patient.


