
CORN COMMENTS
NO NEW RECOMMENDATIONS
Corn futures finished 5 1/2 cents lower to 1 1/4 cents higher, with front-end contracts falling on pressure from easing concerns about the U.S. attack on Iraq and a strong dollar. Crude oil market strength provided limited support for prices along with another strong weekly export inspections total. May corn fell 2 3/4 cents to $4.45 3/4 and July fell 1 3/4 cents to $4.54 1/4, while Dec. futures rose 1/2 cent to $4.70.
The chart picture for corn futures is looking a bit uncertain this afternoon after old-crop contracts finished well off their overnight highs. Most-active May futures broke out the top of their recent trading channel to a 7-week high of $4.52 1/2 overnight, but finished the day 6 3/4 cents off that high. May futures have nearby chart support at $4.42-$4.43 1/2, with trend-line support at $4.36 3/4. Dec. futures traded to a 3-1/2 month high of $4.72 and although they pulled back a bit, they still posted their highest close since Nov. 13.
Corn futures open interest, which had fallen to a 6-week-plus low last Thursday rose by about 23,000 contracts on Friday’s strength, indicating fresh buying was entering the market, which is technically positive.
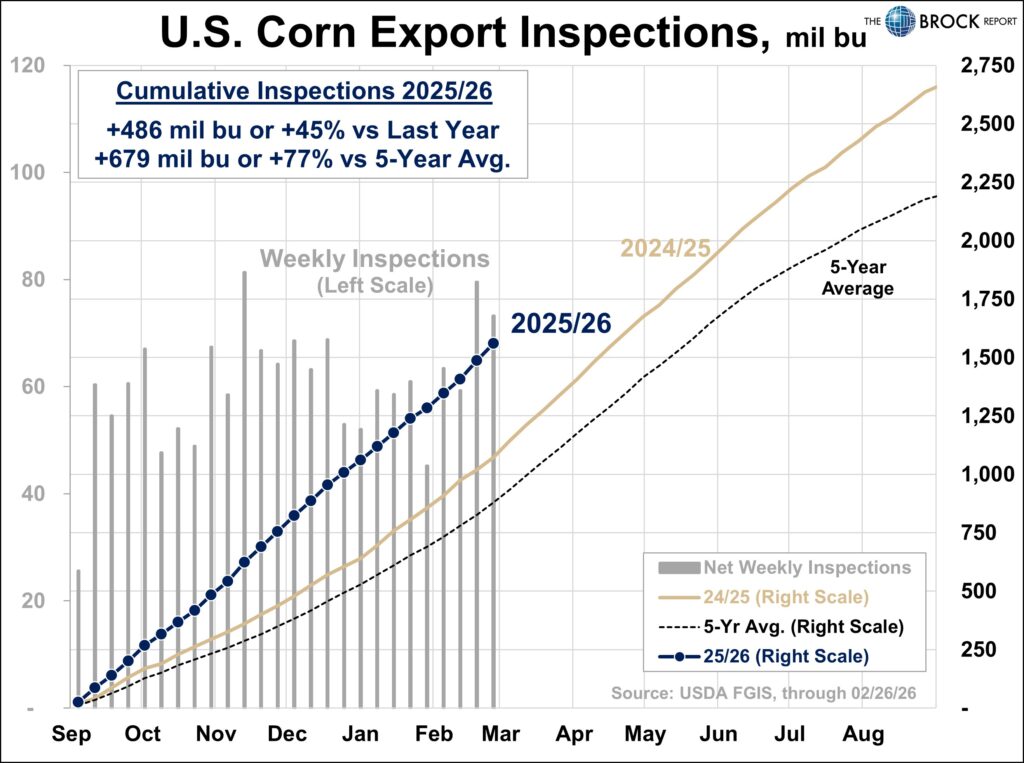
Net corn export inspections for the week ended Feb. 26 totaled 73.2 mil. bu., down from the previous week’s 79.5 mil., but up from 53.2 mil. a year earlier and above trade expectations. Corn export inspections for the marketing year to date total nearly 1.560 bil. bu., up 45.3% from a year earlier.
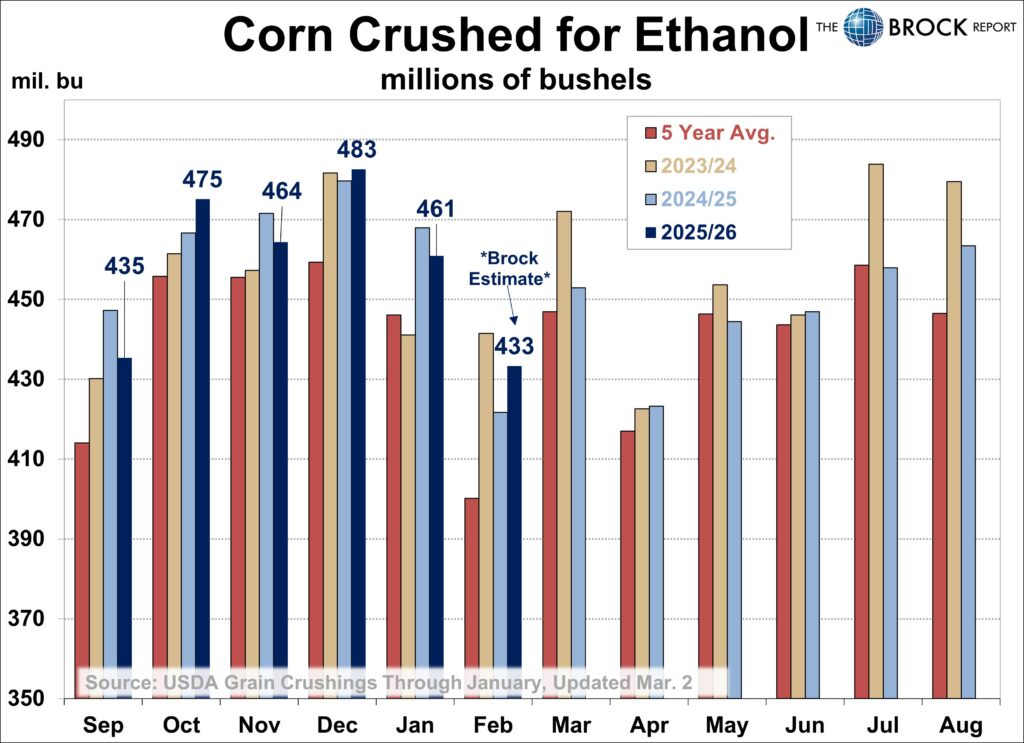
This afternoon’s USDA Grain Crushings and Co-Products Production report pegged January corn-for-ethanol use at 460.9 mil. bu., down 4.5% from 482.6 mil. bu. in December and 1.5% from 467.9 mil. bu. in January 2025. September-January corn-for-ethanol use of 2.318 bil. bu. was down 0.6% from a year earlier and was behind pace to meet USDA’s marketing year forecast for an increase of 3.0%.
Drought relief is still expected in the Midwest, Delta and southeastern U.S. Plains over the next two weeks. Rain will fall significantly from northeastern Texas through the northern and western Delta and lower Missouri River Valley to the heart of the Midwest. Multiple inches of rain will result with the most anomalous precipitation expected from mid-week this week out through March 12.
Nationwide planting of Brazil’s safrinha corn crop was 64.9% complete as of Saturday up significantly from 46.7% a week earlier and ahead of the 5-yr. avg. pace of 57.2%, but below last year’s pace of 69.5%.
Central Illinois processors spot basis bids range are steady to 1 cent stronger, ranging from 14 under to 2 cents under May futures, according to USDA. CIF basis bids for delivery of corn to U.S. Gulf are weaker vs. Friday afternoon. The CIF bid for March delivery is unquoted, with the bid for April delivery is 2 cents weaker at 84 over May futures, while the bid for May delivery is at 83 over.
SOYBEAN COMMENTS
NO NEW RECOMMENDATIONS
Soybean futures settled between 7 1/4 cents lower and 1 1/4 cents higher with front-end contracts weakest under pressure from easing concerns about the U.S. attack on Iran, a strong dollar and technically-driven speculative profit taking. Soymeal futures weakness also weighed on futures, while continued soyoil price strength limited weakness. The 2026-crop futures managed to post small gains. May soybeans fell 6 3/4 cents to $11.64, while July fell 5 3/4 cents to $11.77 and Nov. rose 1/2 cent to 11.24 3/4. May soyoil futures rose 89 points to 62.74 cents, while May soymeal fell $7.60 to $312.90.
The further upside for old-crop soybean prices is very much in doubt this afternoon after most-active May soybean posted a bearish key reversal off of a 22-month high. May futures traded as high as $11.85 and ended the day 21 cents off that high. Follow-through weakness will be needed, though to confirm soybean futures have put in a significant high. May soybeans now have nearby chart support at $11.57 1/2 and $11.45 3/4. Nov. soybeans traded to a 21-month-plus high of $11.36 before pulling back and still posted their highest close since mid-November.
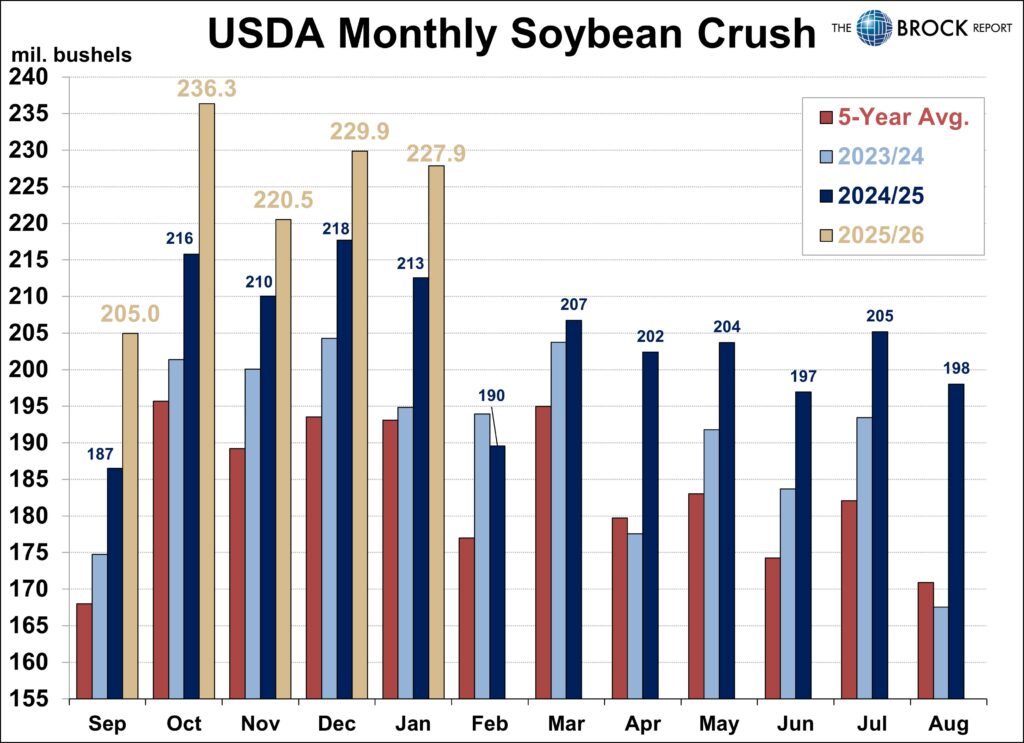
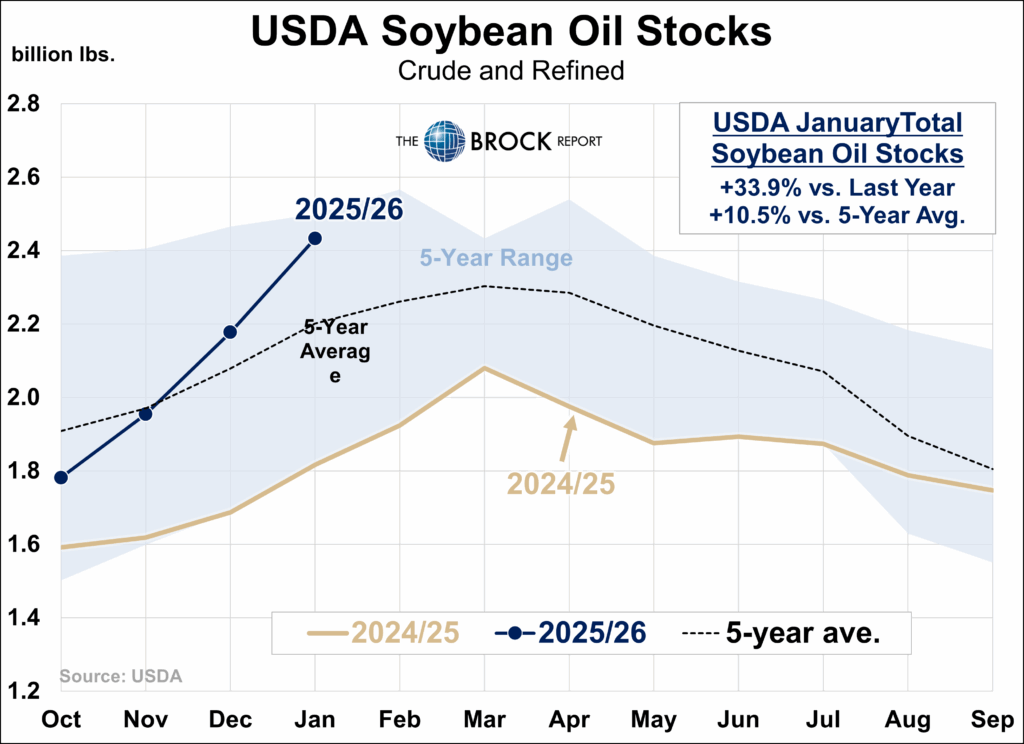
This afternoon’s monthly USDA Fats and Oils report pegged the full U.S. soybean crush for January at 227.86 mil. bu., down 0.9% from 229.87 mil. in December, but up 7.2% from 212.55 mil. in January 2025. The crush was slightly larger than the avg. of pre-report trade estimates at 226.3 mil. bushels. USDA pegged U.S. Jan. 31 soyoil stocks at 2.433 bil. lbs., up 11.8% from a month earlier and 30.3% from a year earlier. Stocks were slightly above the avg. of trade estimates at 2.418 bil. lbs.
Brazil’s 2025-26 soybean harvest reached 41.7% complete as of Saturday, up from a revised 31.9% a week earlier and ahead of the 5-yr. avg. of 38.4%, but behind last year’s pace of 48.4%, according to CONAB. CONAB estimated that another 27.3% of the crop was mature, with another 25.3% filling pods. Weather for the next several days should continue to allow good harvest progress.
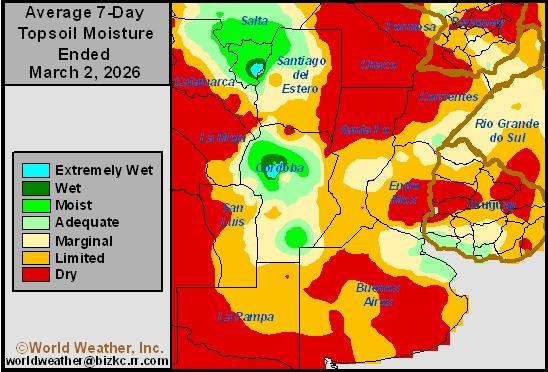
In Argentina, February precipitation helped limit significant production losses after a drier than normal environment in January. However, some of the earliest-planted crops likely saw production reduced due to the extended period of drier weather. Alternating periods of rain and sunshine are slated for much of crop country this week. Additional rain will continue to support relatively good late-season development, though the precipitation may be too late to improve conditions for the earliest-planted crops.
Central Illinois processors have switched spot soybean basis over to the May futures contract. Bids range from 15 under May futures to par with the board, according to USDA. CIF basis bids for delivery of soybeans to the U.S. Gulf are mixed vs. Wednesday afternoon. The bid for Mar. delivery is 15 cents weaker at 90 over Mar. futures and the bid for April delivery is 2 cents weaker at 90 over May futures, while the bid for May delivery is 5 cent weaker at 87 over.
WHEAT COMMENTS
NO NEW RECOMMENDATIONS
Wheat futures ended lower, with sharp losses in Chicago in particular as the market gave back most of Friday’s gains on profit-taking and pressure from a sharply higher U.S. dollar. Chicago settled down 10 to 17 cents amid bear-spreading. March settled at $5.74 ½, while May settled at $5.77 1/4 and July settled at $5.85 ½. Kansas City wheat was down 5 to 6 cents, settling at $5.67 in the March, $5.74 ¾ in the May and $5.88 ¼ in the July. Minneapolis wheat was down 1 to 3 cents, settling at $5.97 ½ in the March, $6.10 in the May and $6.24 ¼ in the July.
It was an up and down start to the week following the U.S. attack on Iran over the weekend. Futures strength last week was in part tied to worries about the Iran situation and the potential for a broader Middle East conflict raising food security concerns. So today’s selloff may have been some “buy the rumor, sell the fact” trade. Another likely reason is the surge in the dollar, which was up by nearly a full percentage point. Whatever the reason, wheat futures across all three classes made new 7-month highs before plummeting. Chicago May wheat traded a range of $5.75 to $6.04, while K.C. traded a range of $5.70 ¾ to $5.95 ¼. The good news for wheat bulls is that the market did not take out Friday’s lows, although Chicago came within three cents of doing so. A close below those lows would have established a bearish key reversal. So technically, today could have been worse.
Concerns that U.S. wheat has been priced out of the export market may also be weighing on prices along with prospects for rainfall this week in U.S. winter wheat areas. World Weather notes that temperatures have been “bouncing around” in the Plains, which has limited crop development. It also notes that damaged wheat in the Plains needs “a mild to cool spring and frequent precipitation for successful new tillering to take place,” but adds that “for now, those conditions seem unlikely and a warm and dry bias could further harm some of the damaged crop.” That said, NOAA’s outlook for March issued on Friday shows above-average temperatures, but also above-average precipitation.
U.S. wheat export inspections for the week ended Feb. 26 totaled 12.7 million bushels, down from 20.7 million a week earlier and 14.4 million a year earlier. Wheat export inspections for the year to date of 684.1 million bushels were 18.8% above a year earlier.
Russian wheat export prices rose slightly last week. The price of 12.5% Russian wheat for free-on-board (FOB) shipment in April was $233.50 per MT at the end of last week, up from $233 a week earlier, according to Dmitry Rylko, head of the IKAR consultancy. SovEcon consultancy estimated the price at $233-$236 per MT vs. $232-$236 a week earlier.
COTTON AND RICE COMMENTS
NO NEW RECOMMENDATIONS
Cotton futures ended lower, retreating as a surging U.S. dollar offset support from a soaring crude oil market. Futures ended up 60 to 100 points, with nearby months showing the most weakness. Thinly traded March cotton settled at 62.59. May settled at 64.59, after trading a range of 64.53 to 65.76. July settled at 66.41. May cotton fell to its lowest level since Feb. 20. It appears to have potential support around 64.50. If that doesn’t hold, the contract low is at 62.86.
NOAA’s outlook for March issued on Friday shows warm temperatures and above-average temperatures across most of Texas and the Delta region. The Southeast could remain a concern though headed into planting. Virtually all of Georgia, the second-largest cotton state, and the Carolinas are in drought currently, and NOAA projects above-average temperatures in March, with equal chances of above or below average precipitation.
Rice futures were the lone gainer among the grains today, climbing 22 to 24 cents amid short-covering after recent losses, technical buying and support from expectations of a big drop in acres this year. March rice settled up 22 ½ cents to $10.62, May was up 23 cents to $10.97 ½ after trading a range of $10.57 ½ to $11.05 ½, and July was up 22 ½ cents to $11.30 ½.
Along with reduced acreage expectations amid widespread financial stress for growers in the Mid-South, the rice market may also get some support from food security concerns tied to the prospect of war in the Middle East.
LIVESTOCK COMMENTS
NO NEW RECOMMENDATIONS
LEAN HOG FUTURES finished 15 cents lower to 25 cents higher in choppy trading as firm midmorning cash fundamentals underpinned prices against pressure from technically-driven speculative profit taking. Nearby April futures finish 15 cents lower at $95.58, while June hogs fell 8 cents to $109.47 and July futures fell 8 cents to $111.60.
April lean hogs charted an outside day down, but given that they finished only 15 cents lower that probably doesn’t mean much. April now has nearby chart resistance at $96.55-$96.65, with nearby support at $95.08. July hogs have nearby chart resistance at $112.33-$112.65, with nearby support at $111.25. There’s still a possible double-top in place on the July chart. Oct. lean hogs charted an outside day up but just barely. Our stop in Oct. hogs was not triggered and the market has nearby resistance now at $93.28, with nearby support at $92.63.
The composite pork cutout value rose 73 cents to $98.50. The national avg. negotiated cash carcass value was $1.49 higher at $91.87, while the midafternoon weighted avg. price for hogs sold under swine/pork market formula agreements was $89.36, up $1.07 from Thursday. Today’s estimated hog slaughter was 482,000 head, up 5,000 from last week, but down 1,000 vs. last year.
LIVE CATTLE FUTURES stabilized after last week’s collapse, posting gains of 38 to 88 cents on apparent support from speculative bargain hunting and their discounts to cash as well as firmer wholesale beef prices. Most-active April live cattle rose 88 cents to $233.10, while June live cattle rose 50 cents to $229.65.
FEEDER CATTLE FUTURES posted gains ranging from $1.85 to $2.28 on support from their discounts to cash, live cattle market gains and corn market weakness. Most-active April feeder cattle rose $2.13 to $353.33, while May futures rose $2.28 to $349.48. The CME cash feeder cattle index fell 97 cents this afternoon to $371.82.
Nearby April live cattle finished more than $4.50 off of the 2-month-plus low they charted this morning after trading within about 40 cents of their 200-day moving average and may have already charted a significant low. The market now has nearby chart resistance at $233.10 and $237.05. Most-active April feeder cattle futures finished more than $7.50 off their morning low of $345.65 and may also have already put in a significant price low. April feeders now have nearby chart resistance at $353.90 and $358.83.
Plains direct cash live cattle markets remained quiet as is normal for a Monday, with no packer bids or feedlot asking prices established. With futures stabilizing, this may be another week in which we don’t see significant cash trade develop before Thursday or Friday. Prices appear likely to trade steady to lower. USDA has reported last week’s Nebraska negotiated trade totaled 17,264 head, down from the previous week’s 24,321 head, with live trade at $239-$243, down $5-$8 from a week earlier and dressed trade at $382-$383, mostly $383, down $5. Last week’s Kansas negotiated trade totaled 4,390 head at mostly $244 live, down $5 from a week earlier.
Beef cutout values ranged from $1.50 to $3.90 higher this afternoon, with the choice cutout at $382.34. Today’s estimated cattle slaughter was 102,000 head, down 4,000 from last week and 3,000 from last year.
BROCK MARKET POSITIONS
CORN: Cash-only Marketers: 2025 CROP: 40% sold on hedge-to-arrive contracts (2-5-25, 2-24-25, 6-9-25, 7-9-25, 1-9-26).
2026 CROP: No sales recommended.
Hedgers: 2025 CROP: 40% sold on hedge-to-arrive contracts and regular forward contracts (2-5-25, 2-24-25, 6-9-25, 7-9-25, 1-9-26); aside futures; short July 2026 $5.40 call options against 10% (6-6-25).
2026 CROP: No cash sales recommended; aside futures.
SOYBEANS: Cash-only marketers: 2025 CROP: 70% sold on hedge-to-arrive contracts or regular forward contracts (2-12-25, 6-23-25, 7-9-25, 9-2-25, 11-4-25, 12-1-25, 2-13-26, 2-20-26).
2026 CROP: 10% sold on forward contracts (2-20-26).
Hedgers: 2025 CROP: 70% sold on hedge-to-arrive contracts or regular forward contracts (2-12-25, 6-23-25, 7-9-25, 9-2-2025, 11-4-25, 12-1-25, 2-13-26, 2-20-26); aside futures.
2026 CROP: 10% sold in the cash market on forward contracts (2-20-26); aside futures.
SRW WHEAT: Cash-only Marketers: 2025 CROP: 100% sold on hedge-to-arrive and regular forward contracts (5-30-24, 6-4-24, 10-15-24, 2-24-25, 6-9-25, 6-10-25, 6-24-25, 11-6-25, 1-28-26, 2-1-26, 2-25-26), aside futures. 2026 CROP: No sales advised.
Hedgers: 2025 CROP: 100% sold on hedge-to-arrive and regular forward contracts (5-30-24, 10-15-24, 2-24-25, 6-9-25, 6-10-25, 6-24-25, 11-6-25, 1-28-26, 2-1-26, 2-25-26); 2026 CROP: No sales advised.
HRW WHEAT: Cash-only Marketers: 2025 CROP: 100% sold on hedge-to-arrive and regular forward contracts (5-30-24, 6-4-24, 10-15-24, 2-24-25, 6-9-25, 6-10-25, 6-24-25, 11-6-25, 10-28-26, 1-28-26, 2-1-26, 2-25-26).
Hedgers: 2025 CROP: 100% sold on hedge-to-arrive and regular forward contracts (5-30-24, 10-15-24, 2-24-25, 6-9-25, 6-10-25, 6-24-25, 11-6-25, 1-28-26, 2-1-26, 2-25-26); aside futures. 2026 CROP: No sales advised.
LEAN HOGS: Short April 2026 lean hog futures on 25% of 1st qtr. marketings and 50% of 2nd qtr. marketings (2-9-26, 2-12-26), short July 2026 lean hog futures on 50% of 3rd qtr. marketings (2-12-26); short Oct. 2026 lean hog futures on 50% of 4th qtr. marketings (2-12-26).
LIVE CATTLE: Aside futures.
FEEDER CATTLE: Feeder sellers are aside futures. Feeder buyers also remain aside futures.
MILK: No forward cash sales advised; aside futures.
FEED BUYERS: CORN: 100% of first qtr. needs covered in cash market. SOYMEAL: 100% of 1st qtr. needs bought in the cash market; 100% of 2nd qtr. needs bought in the cash market (1-7-26); 25% of 3rd qtr. needs covered in cash market (2-12-26).
COTTON: Cash-only Marketers: 2024 CROP: 100% sold (2-12-24, 2-27-24, 4-3-24, 6-27-24, 6-28-24, 3-13-25, 3-18-2025, 4-28-25, 6-24-25, 7-16-25). 2025 CROP: 20% sold in the cash market (9-17-25, 2-26-26).
Hedgers: 2024 CROP: 100% cash sold (2-12-24, 2-27-24, 4-3-24, 6-27-24, 3-13-25, 3-18-25, 4-28-25, 6-24-25, -16-25), aside futures: 2025 CROP: 30% sold in the cash market (9-17-25, 2-26-26). Aside futures.
RICE: 2024 CROP: 100% sold (5-3-24, 5-8-24, 5-28-24, 5-29-24, 7-15-2024, 7-30-24, 9-24-24, 2-21-25. 4-29-25, 7-18-25). 2025 CROP: 30% sold (6-9-25, 1-28-26, 2-10-26).


