
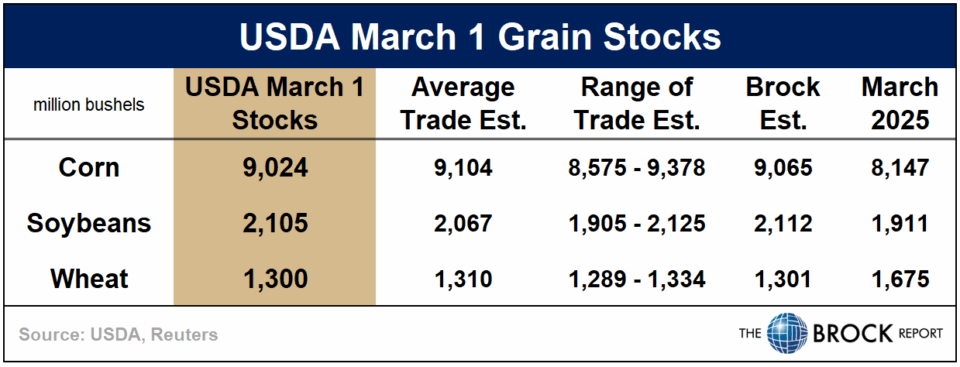
The USDA’s quarterly Grain Stocks report, released yesterday, offered updated estimates for corn, soybean, and wheat inventories as of March 1. The data largely aligned with expectations, with no major surprises across the board. Corn stocks showed the largest deviation from our estimate, though the difference was relatively minor at just 59 million bushels lower.
Corn
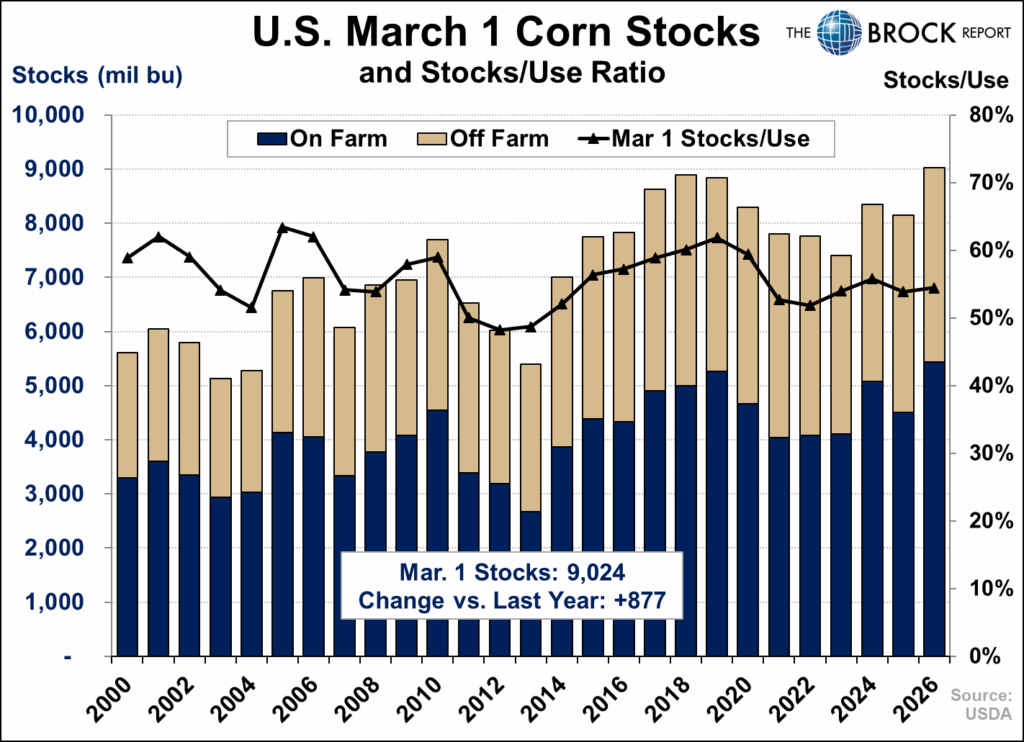
The USDA pegged 2025/26 March 1 corn stocks at 9,024 million bushels, the highest March 1 inventory on record. Of that total, 5,432 million bushels are held on-farm, with the remaining 3,592 million stored off-farm. Despite these record-large inventories, the stocks-to-use ratio for the December–February quarter came in at just 54.4%, a relatively tight figure given the supply backdrop. For comparison, the last time March 1 stocks approached similar levels (2017–2019), stocks-to-use ratios pushed as high as 62%. This highlighting the strength of demand, particularly from exports and feed usage.
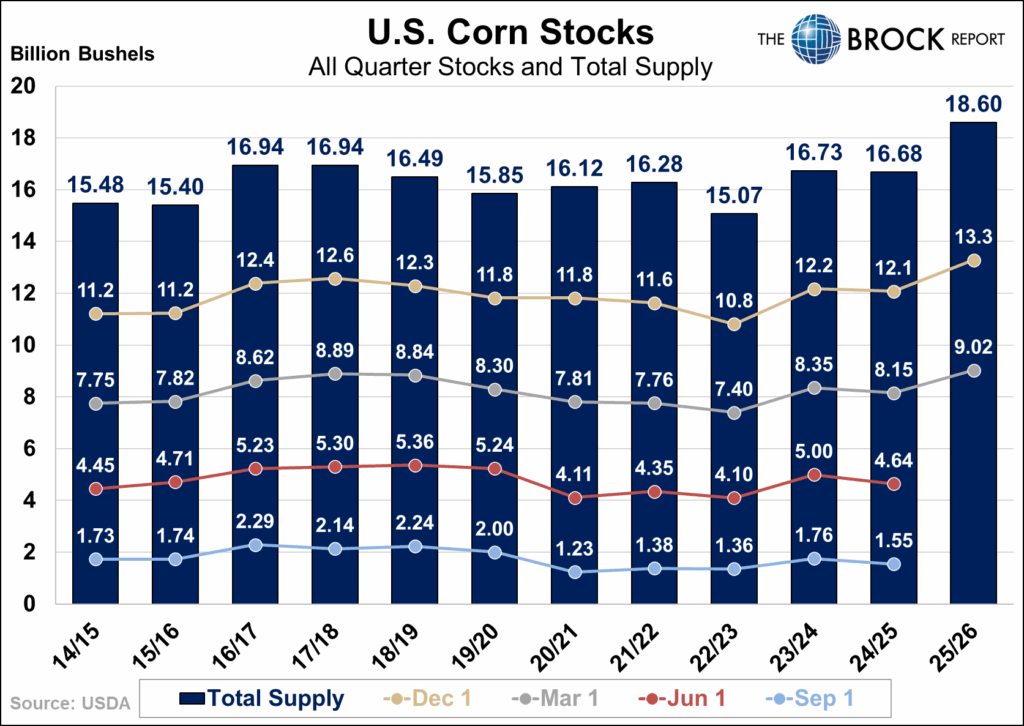
Looking at the All Quarters Stocks chart, elevated stock levels are largely a function of record supply, with 2025/26 total supply coming in at 18.6 billion bushels. March 1 corn stocks as a percent of that supply sit at 48.53%, the third lowest among the years shown. This reinforces the narrative of strong usage, as a historically large supply is being worked through.
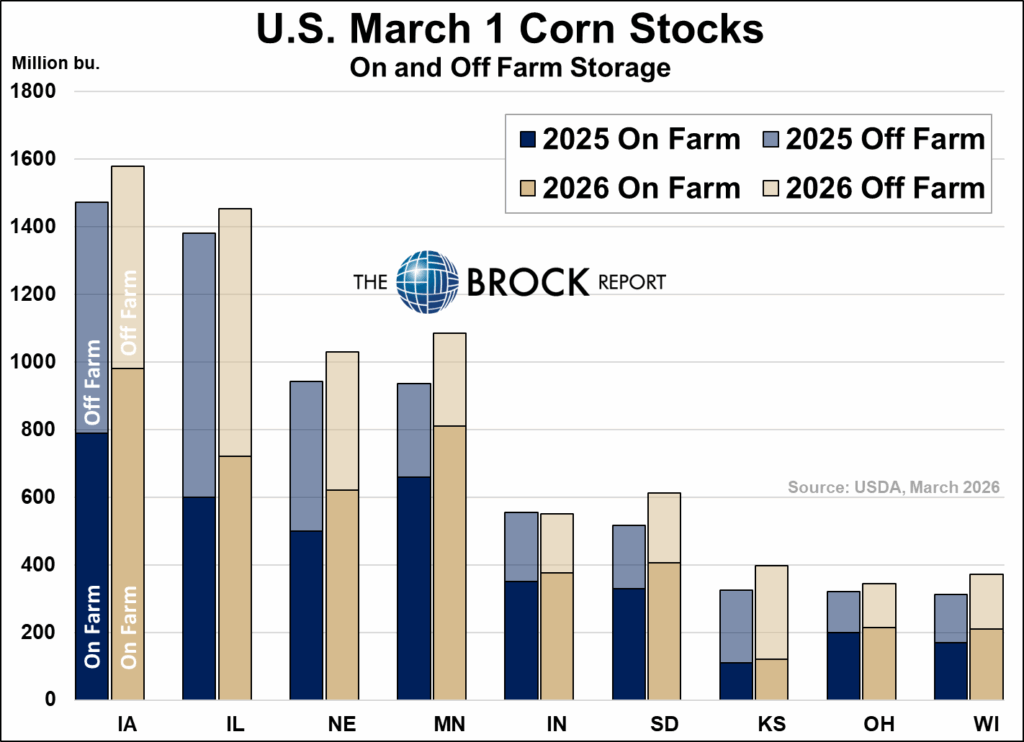
March 1 corn stocks increased across most major states year-over-year, with gains in both on-farm and off-farm storage. Larger inventories in states like Iowa, Illinois, and Minnesota highlight the large supply, while increased on-farm storage suggests producers continue to hold large amounts of corn.
Soybeans
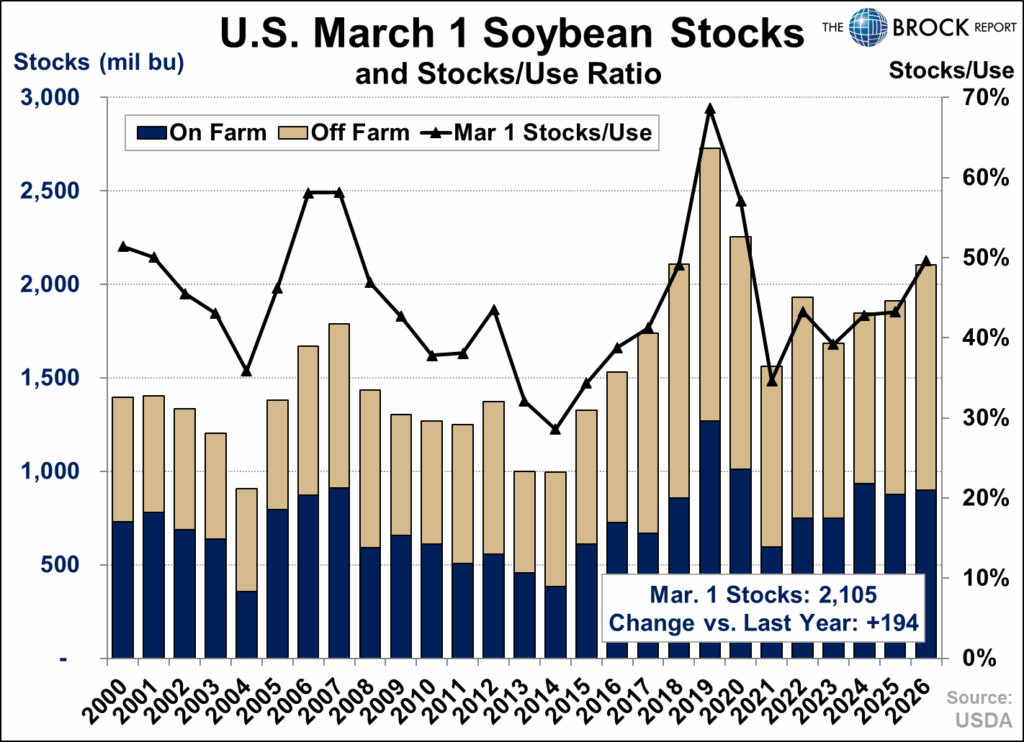
The soybean inventory numbers show totally different story than corn. Despite lower overall U.S. supplies compared to a year ago, stocks remain elevated, with March 1 inventories at 2,105 million bushels. Of that total, 900 million bushels are held on-farm, with 1,205 million off-farm. The stocks-to-use ratio came in at 49.7%, up more than 6 percentage points from a year ago.
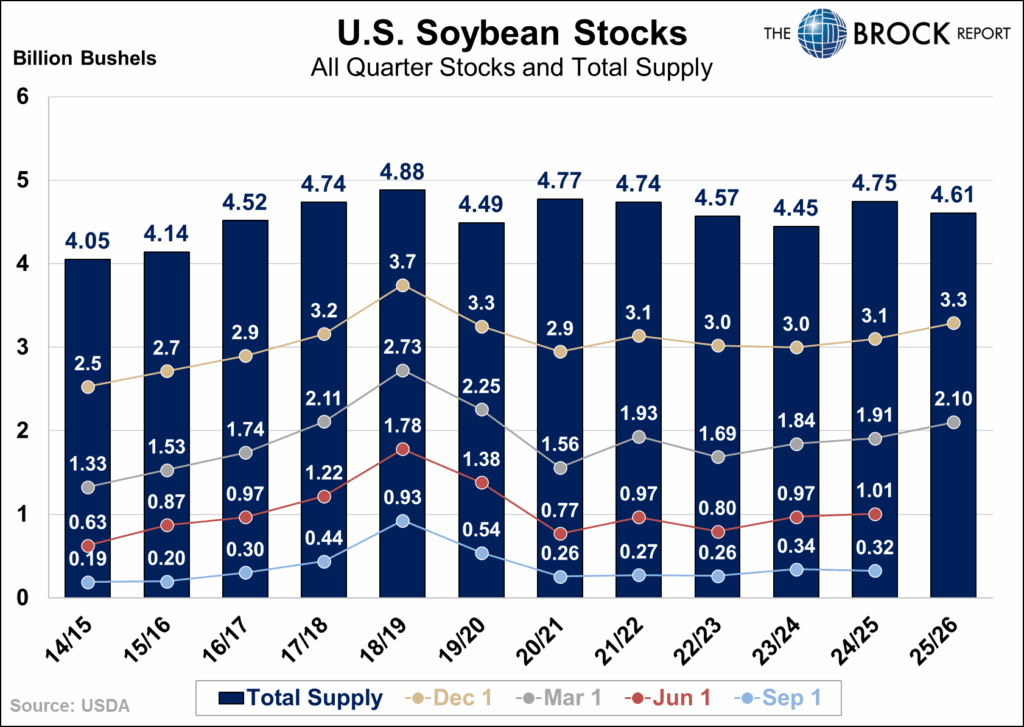
March 1 soybean stocks as a percent of total supply came in at 45.7%, the highest since 2020. For comparison, last year’s March 1 stocks were closer to 40% of supply. This higher percentage reflects softer demand, particularly in the export market from China.
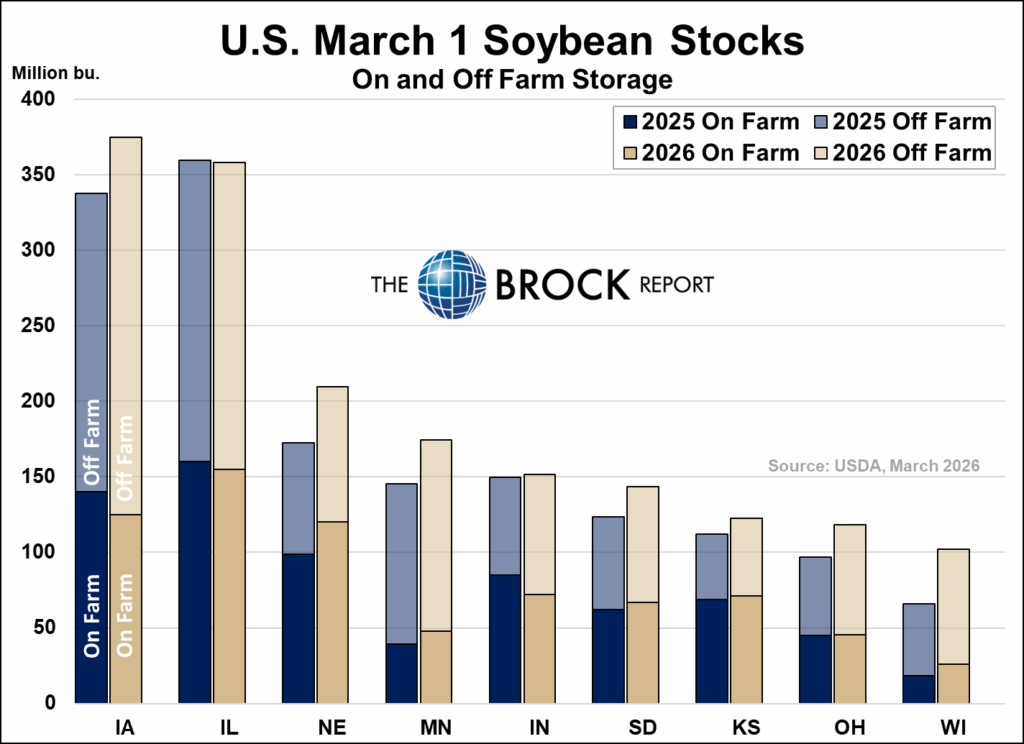
Despite the large increase in overall March 1 stocks, on farm storage was up just 23 million bushels. Supported largely by decreases in soybeans on-farm in the two key states of Iowa and Illinois.
Wheat
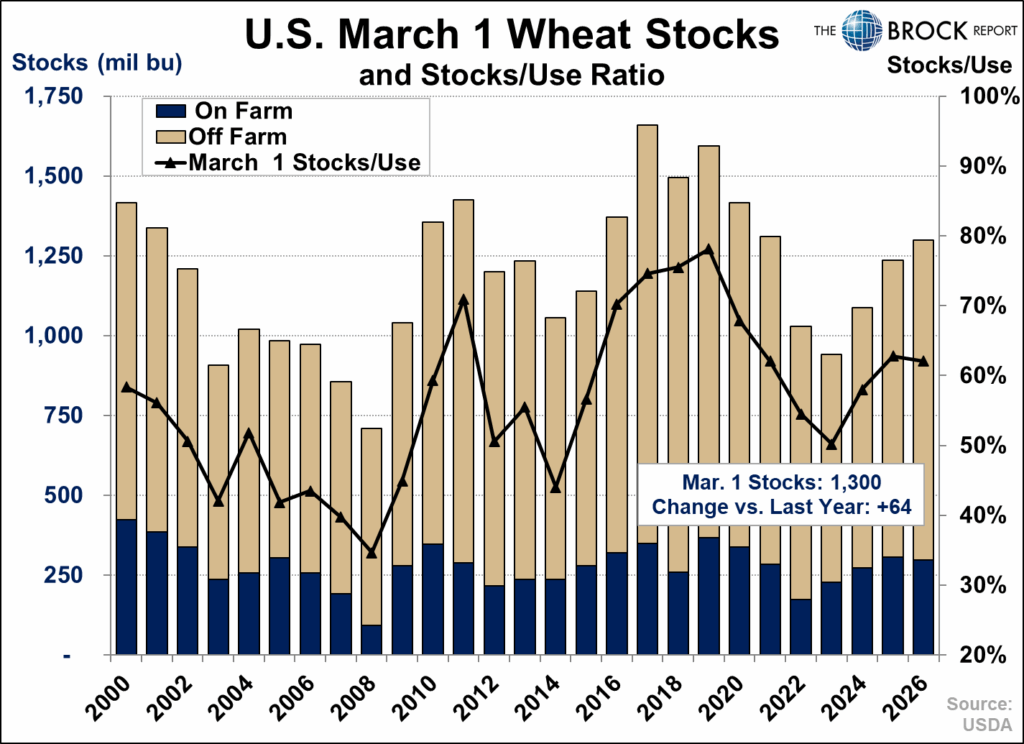
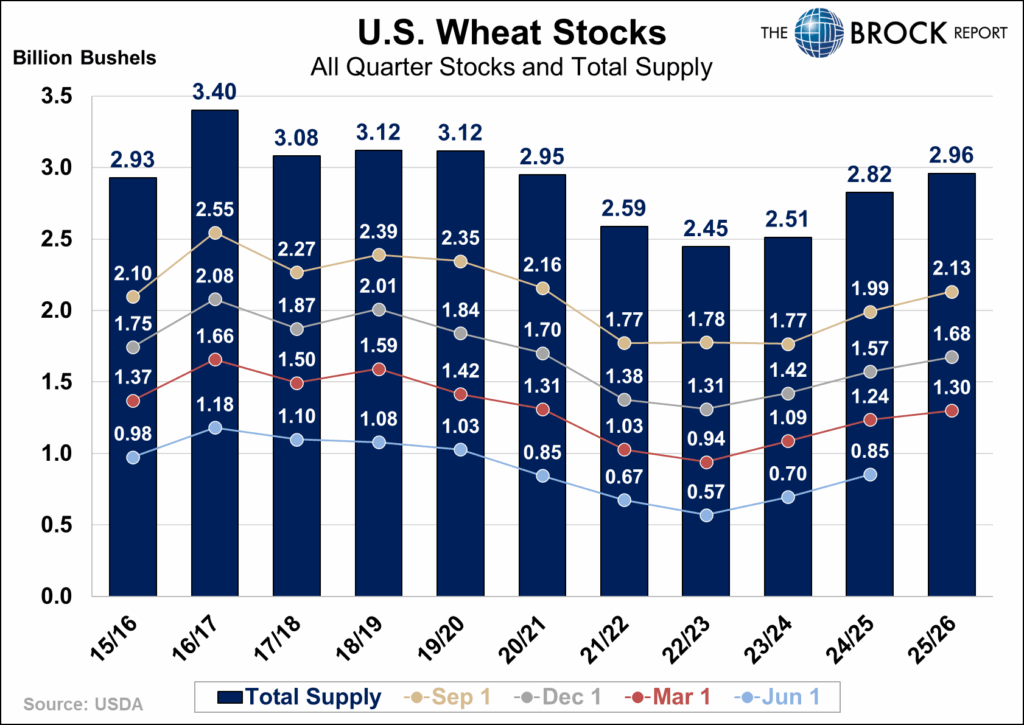
The wheat inventory picture looks more similar to corn, with stronger usage offsetting higher stocks. March 1 wheat inventories totaled 1,300 million bushels, including 298 million on-farm and 1,002 million off-farm. Despite stocks being up year-over-year, the stocks-to-use ratio declined to 62.1%, down more than 1 percentage point from last year.
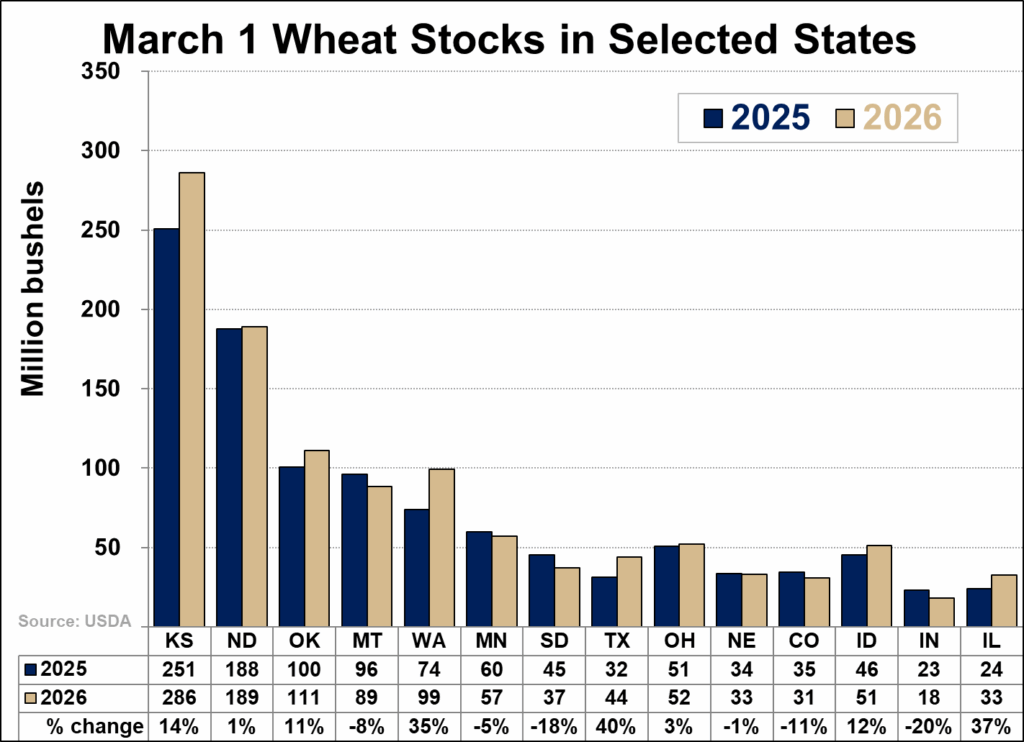
State by state data shows the biggest increases coming in Kansas and Washington. Kansas was up 35 million bushels and Washington was up 26 million bushels.