Going into Monday’s annual USDA Crop Acreage report, the corn futures market seems to be factoring in an increase in corn plantings over the March intentions of 95.3 million acres, although on average, the trade expects almost no change. Trade expectations in a Bloomberg survey of 31 analysts average 95.4 million acres. History strongly favors an increase in corn acres from the March intentions. The June corn acreage total has come in above the March intentions eight of the past 10 years, and 16 of the past 20. Corn acreage has also exceeded trade expectations in seven of the past 10 years, and 13 of the past 20. The June acreage has been more than 2% above the average of trade expectations five times in 20 years, but the rise in acreage from March to June has exceeded 2% only three times – in 2007, 2009 and 2023. June corn acreage fell more than 2% below the March intentions and trade expectations only once – in 2020. So, all in all, it would seem that odds of a big surprise for the corn market in the Crop Acreage report are actually low.
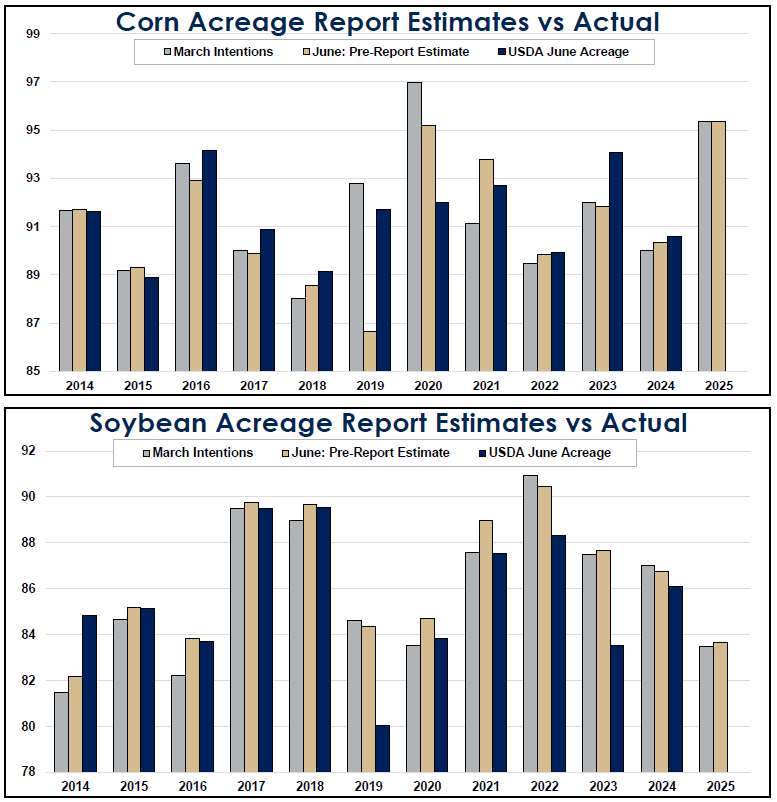
For soybeans, it’s difficult to tell whether the futures market is factoring in a drop in acreage from the March planting intentions. Recent history strongly favors a June soybean acreage total lower than the March intentions and below the average trade estimate, both of which are at 83.5 million acres. USDA’s soybean acreage estimate has fallen from March to June five of the past six years and June acreage has come in below the average of trade expectations in 10 consecutive years. We would note that this is a big shift from most of the decade of the 2010s, when June soybean acres were higher than March intentions seven straight years, from 2012 to 2018, as U.S. exports to China boomed. Overall, over the past 20 years, acreage rose from March to June 10 times and fell 10 times. The shift in acreage from March to June has exceeded 2% three times in the past 10 years, and seven times in the past 20.
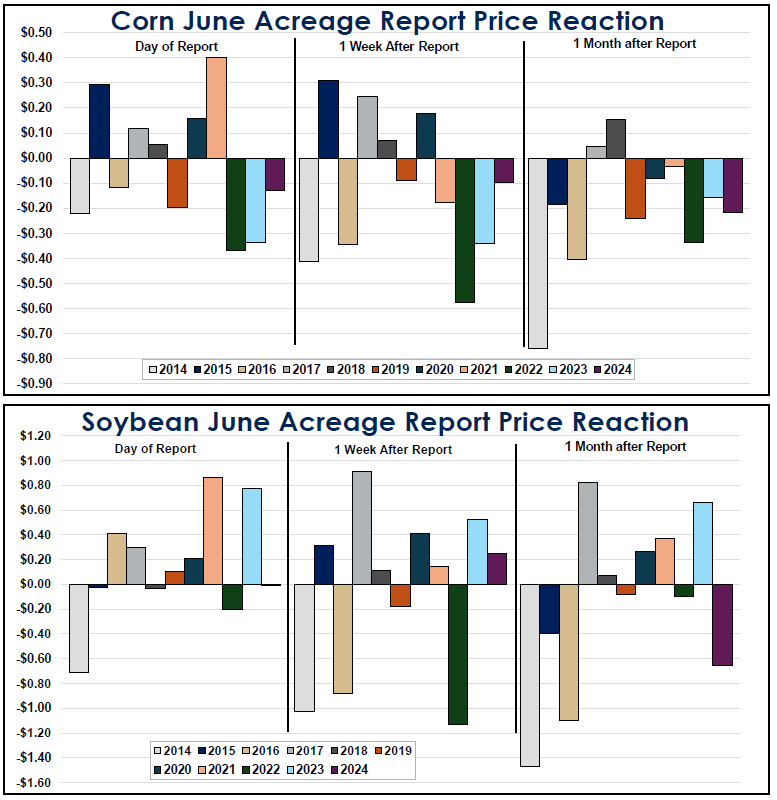
Futures markets reactions to the June 30 USDA Crop Acreage and Grain Stocks reports have been significant, but a mixed bag. Over the past 10 years, Dec. corn futures have risen on report day five times, by anywhere from 12 to 40 cents, and has fallen five times, by anywhere from 11 ¾ to 37 cents. A week out, futures have been lower than they were before the reports in four of the past 10 years, but looking a month out, futures have been lower in eight of 10 years, by anywhere from 8 cents to 7 ¾ cents. Moral of the story: Don’t expect these USDA reports to spark a long-lasting corn price rally.
Over the past 10 years, soybean futures have risen six times on report day, by anywhere from 10 ¾ to 86 ½ cents, and have fallen four times, by between ¾ of a cent and 70 ¾ cents. One week out, soybean futures have been higher than before the report seven out of the past 10 years, while one month out they have been higher in only five out 10 years, by anywhere from 7 ½ to 82 ½ cents.